We run a ClickHouse data warehouse with raw trade data from Hyperliquid, Polymarket, and Solana DEXes. Until recently, querying it required either direct database access or running custom scripts. A new HTTP API just went live that wraps it behind a simple REST endpoint. We wanted to test whether it actually works — and happened to have something fresh to test it on: Hyperliquid just launched prediction markets.
Getting access
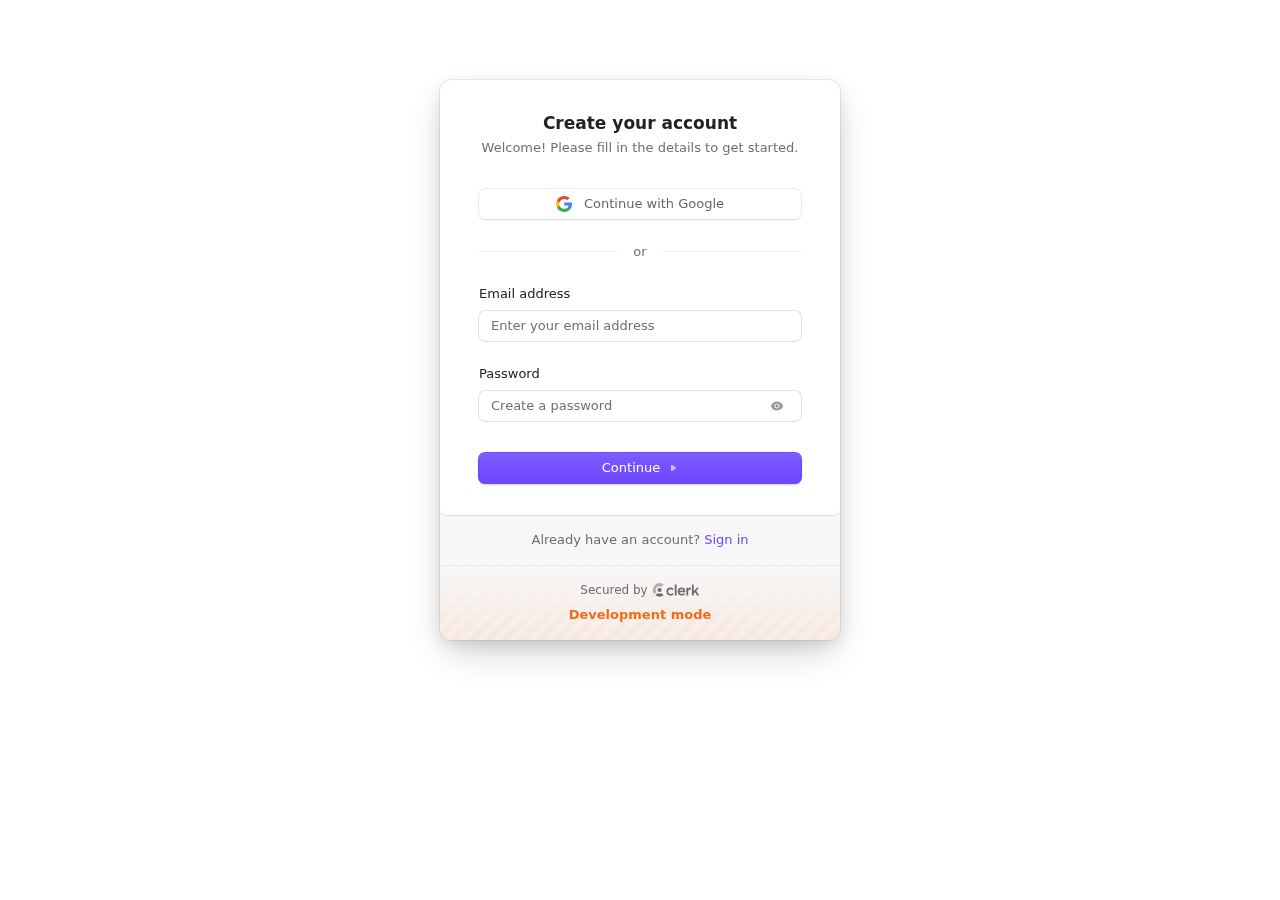
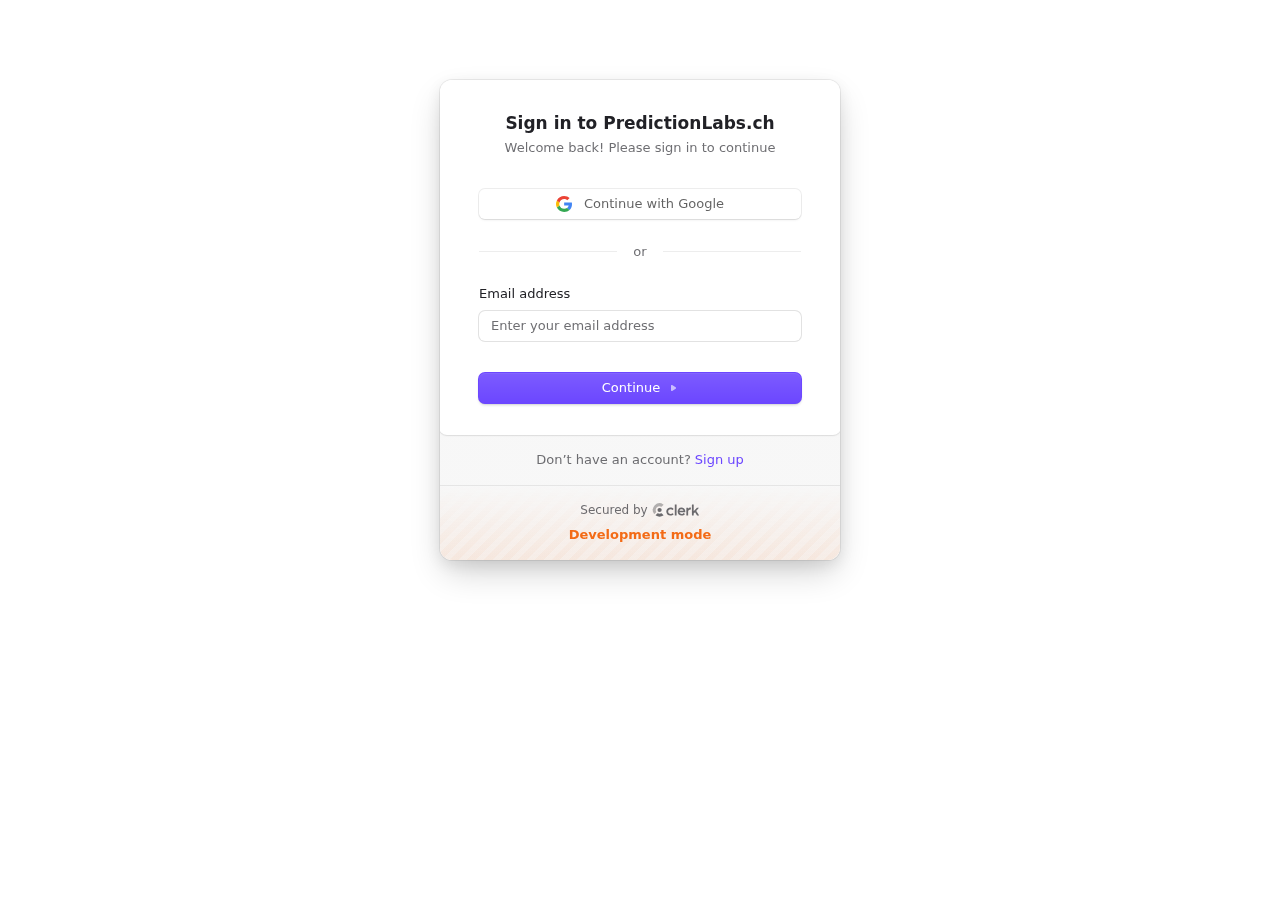
The service is available at db-access-test.onchaindivers.com. Sign up with Google or email to get an API token:
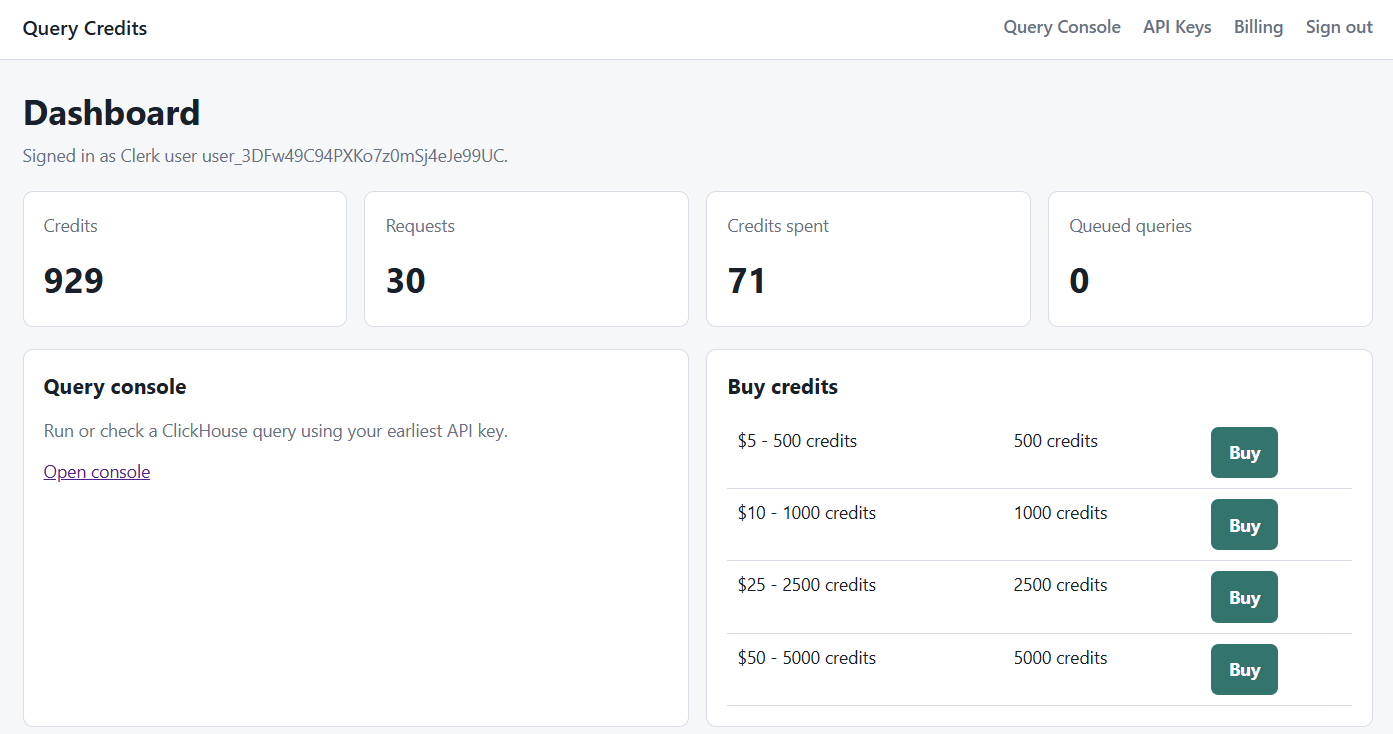
Once logged in, the dashboard shows your API token, usage stats, and available databases:
The API
Three databases are accessible: solana, polymarket, and hyperliquid. All take a POST request with a SQL body:
curl -X POST https://db-access-test.onchaindivers.com/v1/hyperliquid/query \
  -H "Authorization: Bearer <token>" \
  -H "Content-Type: application/json" \
  -d '{"sql": "SELECT 1"}'
Response:
{
  "columns": [{"name": "1", "type": "UInt8"}],
  "rows": [{"1": 1}],
  "meta": {
    "queryId": "6b562f67-bf07-449c-946b-642e3ae3f84b",
    "elapsedMs": 67,
    "queueWaitMs": 0,
    "creditsCharged": 1
  }
}
It works. The meta field is a nice touch — elapsedMs and creditsCharged let you monitor query cost. Only SELECT and WITH queries are allowed; no writes.
Hyperliquid prediction markets
Hyperliquid recently added a “Recurring” prediction market product. The current market is a daily binary: will BTC close above $79,980 at 06:00 UTC?
The outcomeMeta endpoint on the Hyperliquid API returns active markets:
{
  "outcomes": [{
    "outcome": 2,
    "name": "Recurring",
    "description": "class:priceBinary|underlying:BTC|expiry:20260505-0600|targetPrice:79980|period:1d",
    "sideSpecs": [{"name": "Yes"}, {"name": "No"}]
  }]
}
The description is pipe-delimited and self-explanatory: a binary BTC price market expiring on May 5 at 06:00 UTC with a target of $79,980. It runs daily, rolling over to a new round each day at 06:00 UTC.
In the three days since launch, three rounds have run: outcome 0 (settled May 3), outcome 1 (settled May 4), and outcome 2 (currently active through May 5 06:00 UTC).
How outcomes are encoded
This is the part that isn’t obvious from the data alone.
The formula
Hyperliquid encodes each outcome side as:
encoding = 10 * outcome + side
Side 0 is YES, side 1 is NO. From this encoding, three representations are derived:
| Representation | Format | Example |
|---|---|---|
| Coin (in fills) | #<encoding> | #20 |
| Token name | +<encoding> | +20 |
| Asset ID (for orders) | 100_000_000 + encoding | 100000020 |
Real example: current round (outcome 2)
outcome=2, side=0  →  encoding = 20  →  coin "#20"  =  YES
outcome=2, side=1  →  encoding = 21  →  coin "#21"  =  NO
Right now #20 (YES) trades at ~$0.60 and #21 (NO) at ~$0.40. They always sum to $1.00 — the binary property of the market:
0.6027 + 0.3973 = 1.0000 ✓
All six coins in the database follow this pattern:
| Coin | Outcome | Side | Meaning | Active period |
|---|---|---|---|---|
| #0 | 0 | YES | BTC > $79,980? | May 2–3 (settled) |
| #1 | 0 | NO | — | May 2–3 (settled) |
| #10 | 1 | YES | BTC > $79,980? | May 3–4 (settled) |
| #11 | 1 | NO | — | May 3–4 (settled) |
| #20 | 2 | YES | BTC > $79,980? | May 4–5 (active) |
| #21 | 2 | NO | — | May 4–5 (active) |
What fills look like in the raw data
Prediction market fills use fill_type = "Buy" or "Sell" (unlike perpetuals which use “Open Long” / “Close Short”). The key encoding detail: closed_pnl is always 0 on Buy fills — profit is only realized on Sell fills when you exit a position.
Here are two fills from the same trade (buyer and seller matched on the same price):
coin: "#20", fill_type: "Buy",  price: 0.6027, size: 261, closed_pnl: 0
coin: "#21", fill_type: "Buy",  price: 0.3973, size: 261, closed_pnl: 0
The buyer of #20 spent 261 × 0.6027 = $157 to win $261 if BTC closes above $79,980. The buyer of #21 spent 261 × 0.3973 = $104 to win $261 if it doesn’t. Note that 0.6027 + 0.3973 = 1.0000 — these two fills are two sides of the same matched trade.
A profitable exit looks like this:
coin: "#20", fill_type: "Sell", price: 0.603, size: 31, closed_pnl: 0.05956686
Sold 31 YES tokens at $0.603, realizing ~$0.06 profit on a position opened at a lower price.
Query 1: Volume by hour
SELECT
  toStartOfHour(utc_fill_dttm) AS hour,
  sum(price * size)             AS volume_usd,
  count()                       AS trade_count
FROM raw_node_fills_by_block
WHERE coin LIKE '#%'
GROUP BY hour
ORDER BY hour
Selected hours (UTC):
| Hour | Volume | Trades |
|---|---|---|
| May 2 08:00 | $22,604 | 666 |
| May 2 12:00 | $105,171 | 2,300 |
| May 2 18:00 | $416,133 | 4,750 |
| May 2 21:00 | $399,081 | 3,124 |
| May 3 06:00 | $1,850,969 | 5,296 |
| May 3 07:00 | $114,614 | 1,682 |
| May 3 13:00 | $58,199 | 1,056 |
| May 3 20:00 | $226,835 | 3,214 |
| May 4 06:00 | $2,296,554 | 5,516 |
| May 4 07:00 | $62,416 | 1,146 |
| May 4 10:00 | $322,347 | 3,998 |
| May 4 14:00 | $287,204 | 4,158 |
| May 4 17:00 | $202,933 | 4,554 |
The 06:00 UTC spikes stand out immediately — those are the daily settlement and round-transition moments. When an old round settles and a new one opens, volume is 5–10x the normal hourly rate. Traders rush to realize gains, hedge, or open fresh positions.
Query 2: Active traders per hour
SELECT
  toStartOfHour(utc_fill_dttm) AS hour,
  countDistinct(wallet_address) AS traders
FROM raw_node_fills_by_block
WHERE coin LIKE '#%'
GROUP BY hour
ORDER BY hour
Selected hours:
| Hour | Unique traders |
|---|---|
| May 2 08:00 | 203 |
| May 2 15:00 | 368 |
| May 3 06:00 | 1,881 |
| May 3 07:00 | 177 |
| May 3 10:00 | 133 |
| May 4 06:00 | 1,475 |
| May 4 07:00 | 174 |
| May 4 10:00 | 328 |
| May 4 14:00 | 338 |
The settlement pattern is even clearer on a per-trader basis. In normal hours, 130–370 distinct wallets trade. At 06:00 UTC the count spikes to 1,475–1,881. Across all three rounds combined: 3,794 unique traders, 152,108 fills, $13.5M total volume.
Query 3: Top traders by volume
SELECT
  wallet_address,
  round(sum(price * size), 0) AS volume_usd,
  count()                     AS fills,
  countDistinct(coin)         AS coins_traded
FROM raw_node_fills_by_block
WHERE coin LIKE '#%'
GROUP BY wallet_address
ORDER BY volume_usd DESC
LIMIT 10
| Wallet | Volume | Fills | Coins |
|---|---|---|---|
| 0x32000…01ca | $1,031,587 | 2,218 | 2 |
| 0x32000…01cb | $873,624 | 1,309 | 2 |
| 0x0c3405… | $478,620 | 12,078 | 6 |
| 0xc926dd… | $421,675 | 5,328 | 5 |
| 0x11e1fd… | $375,110 | 2,333 | 6 |
| 0xd974cc… | $346,692 | 2,983 | 6 |
| 0x084caf… | $268,849 | 130 | 4 |
| 0x7bfee9… | $263,416 | 253 | 6 |
| 0x160398… | $234,637 | 105 | 1 |
| 0xec5ab7… | $179,579 | 3,458 | 6 |
The top two wallets (0x32000...01ca and 0x32000...01cb) have a distinctive address pattern — the 32000... prefix repeated with only the last bytes varying. They each traded exactly 2 coins (one round’s YES+NO pair) with large average trade sizes. These look like automated market-making positions rather than discretionary traders.
The third wallet (0x0c3405...) is the opposite: 12,078 fills across all 6 coins, meaning it participated in every round on both sides. High frequency, lower average size — market-making or a bot continuously quoting.
Query 4: Top traders by PNL and win rate
Win rate is only meaningful on Sell fills — that’s where closed_pnl is non-zero.
SELECT
  wallet_address,
  round(sum(closed_pnl), 2)                          AS total_pnl,
  countIf(closed_pnl > 0)                             AS wins,
  countIf(closed_pnl < 0)                             AS losses,
  count()                                              AS total_sells,
  round(countIf(closed_pnl > 0) / count() * 100, 1)  AS win_rate_pct
FROM raw_node_fills_by_block
WHERE coin LIKE '#%'
  AND fill_type = 'Sell'
GROUP BY wallet_address
HAVING total_sells >= 5
ORDER BY total_pnl DESC
LIMIT 10
| Wallet | PNL | Win rate | Sells |
|---|---|---|---|
| 0xa3371d… | $9,032 | 100% | 20 |
| 0x6b23d9… | $5,662 | 100% | 61 |
| 0x11e1fd… | $4,679 | 55.9% | 1,196 |
| 0xd974cc… | $4,644 | 50.9% | 1,408 |
| 0x77435… | $3,507 | 77.7% | 385 |
| 0x59629e… | $3,405 | 100% | 242 |
| 0x59526b… | $3,093 | 32.3% | 62 |
| 0xe48fe6… | $3,071 | 100% | 47 |
| 0xf0bb8f… | $2,414 | 83.6% | 586 |
| 0xa40ee9… | $2,406 | 100% | 44 |
A few patterns worth noting. The 100% win-rate wallets have small sell counts (20–242) — these are likely wallets that bought a side, held through settlement, and collected the $1 payout. If you bought YES at $0.40 and BTC ended above the target, you sell at $1.00 and every trade closes in profit.
The two high-frequency traders (0x11e1fd… and 0xd974cc…) with 1,196 and 1,408 sells both sit near 50% win rate — consistent with market-making around the mid-price, where half of exits are small wins and half are small losses, but the spread captures profit overall.
0x59526b... stands out with a 32.3% win rate but positive PNL — it lost more often than it won, but when it won, it won larger. Classic directional betting: take small frequent losses, wait for the big move.
Takeaways
The API works. Query latency is 60–200ms for simple aggregations, up to 3 seconds for full-table scans across all rounds. The creditsCharged field in each response will be useful for rate-limit tracking once we start running regular analyses.
The prediction market data is interesting on its own: settlement dynamics are immediately visible in the hourly data, the binary encoding is compact and consistent, and PNL tracking (via closed_pnl on Sell fills) gives a clean way to evaluate trader performance without needing to reconstruct position history.
Three days of data, $13.5M volume, 3,794 traders. Still early — but the settlement-hour spikes suggest there’s real engagement at round transitions. Worth watching how volume evolves as more traders discover the product.
Table at onchaindivers.com/hyperliquid/tables. Hyperliquid asset ID docs at hyperliquid.gitbook.io.