Do prolific Pumpfun creators produce tokens that reliably hit the same market cap ceiling? We analyzed the new max_caps table to measure creator consistency and predictive power.
Important Context: The $30k Threshold
Before diving into the data, a reality check: tokens with max MCAP below ~$30k are essentially noise. After fees (trading, priority, slippage), you’re likely losing money on these micro-cap tokens regardless of strategy.
Of 10,061 creators with 5+ tokens in March 2026:
- Only 207 creators (2.1%) have average MCAP >= $30k
- These 207 creators launched 2,430 tokens (0.8% of total)
- The other 98% are creating tokens that never reach tradeable levels
This analysis focuses on both the full dataset (for pattern detection) and the “meaningful MCAP” subset (for actionable trading).
Key Findings
| Metric | All Creators | Meaningful MCAP (avg >= $30k) |
|---|---|---|
| Creators analyzed | 10,061 | 207 |
| Total tokens | 323,770 | 2,430 |
| Median CV | 0.27 | ~0.35 |
| Very consistent (CV < 0.3) | 52.5% | ~45% |
The insight: About half of prolific creators show consistent patterns (CV < 0.3). But the truly interesting finding is the 577 creators who’ve produced $100k+ tokens - these are the ones worth tracking.
Understanding Coefficient of Variation (CV)
CV measures how spread out a creator’s max MCAPss are relative to their mean:
CV = Standard Deviation / Mean
Interpretation:
- CV < 0.3: Very consistent - tokens reliably reach similar peaks
- CV 0.3-0.5: Consistent - mostly predictable
- CV 0.5-0.75: Moderate variation
- CV > 1.0: Highly inconsistent - unpredictable outcomes
Consistency Distribution
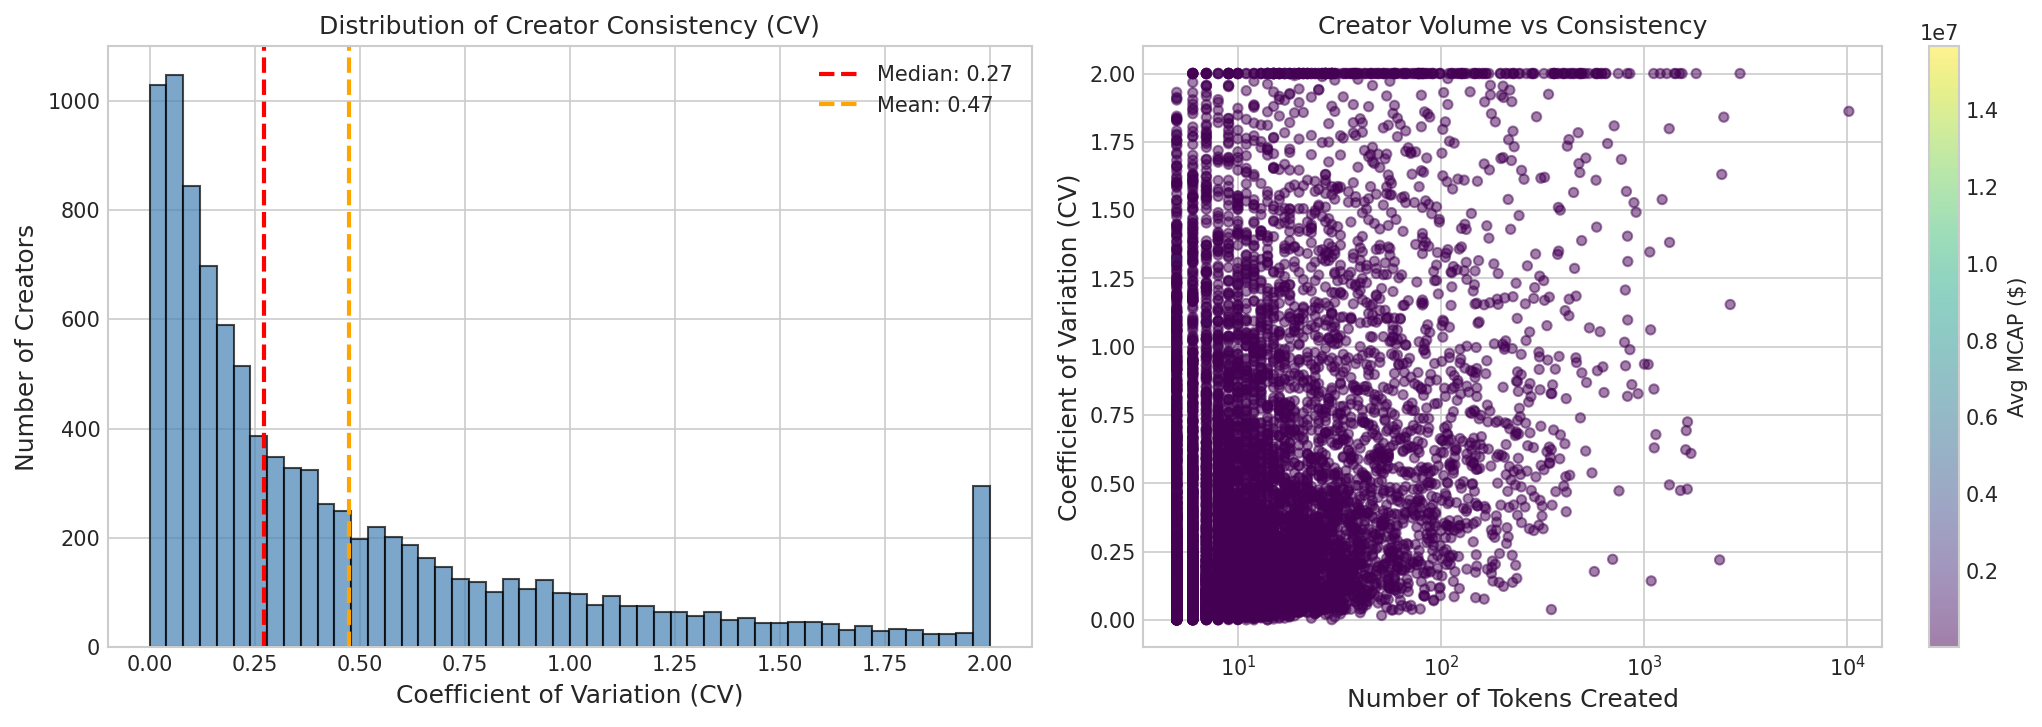
The histogram shows creators clustering around CV = 0.27, with a notable spread. The scatter plot reveals that high-volume creators (100+ tokens) show more variation than in previous months.
CV Distribution Breakdown
| Consistency Level | CV Range | Creators | % |
|---|---|---|---|
| Very Consistent | < 0.3 | 5,282 | 52.5% |
| Consistent | 0.3-0.5 | 1,437 | 14.3% |
| Moderate | 0.5-0.75 | 1,112 | 11.1% |
| Inconsistent | 0.75-1.0 | 699 | 6.9% |
| Highly Inconsistent | > 1.0 | 1,531 | 15.2% |
Price Trajectories by Creator Type
Each line represents one token, normalized to 1.0 at initial price. X-axis is slots since creation.
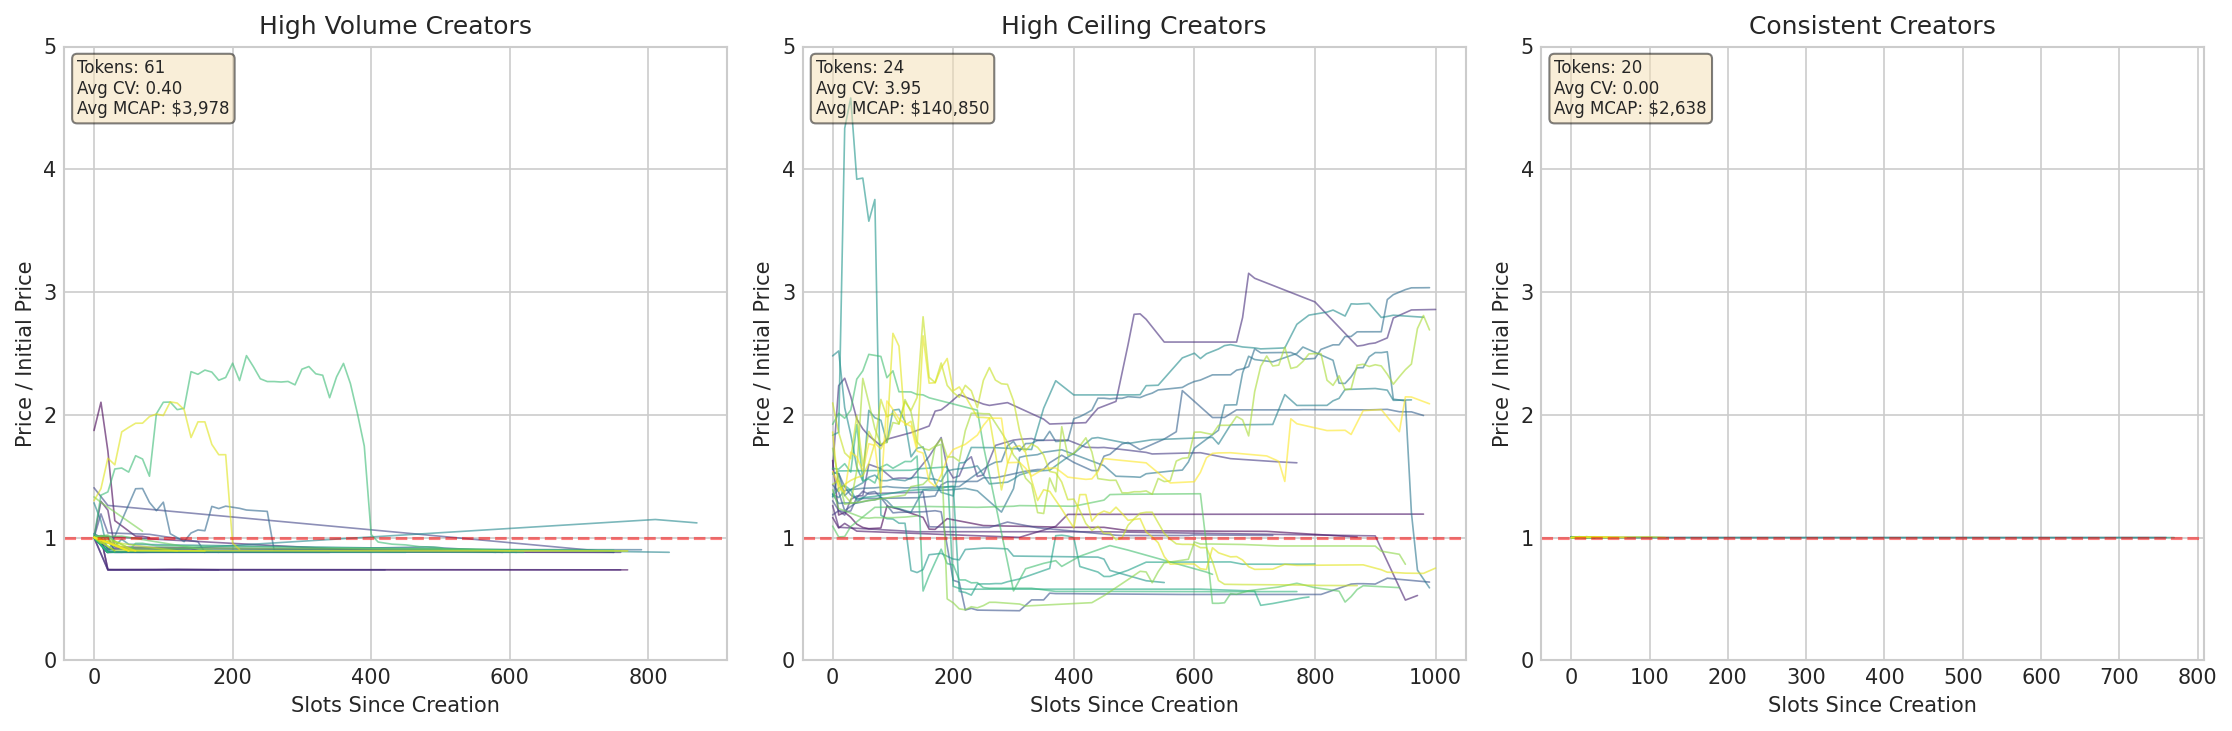
Observations:
- Consistent creators: Tight clustering around initial price
- High volume creators: More variation in trajectories
- High ceiling creators: Larger swings with occasional breakouts
Predictive Power Analysis
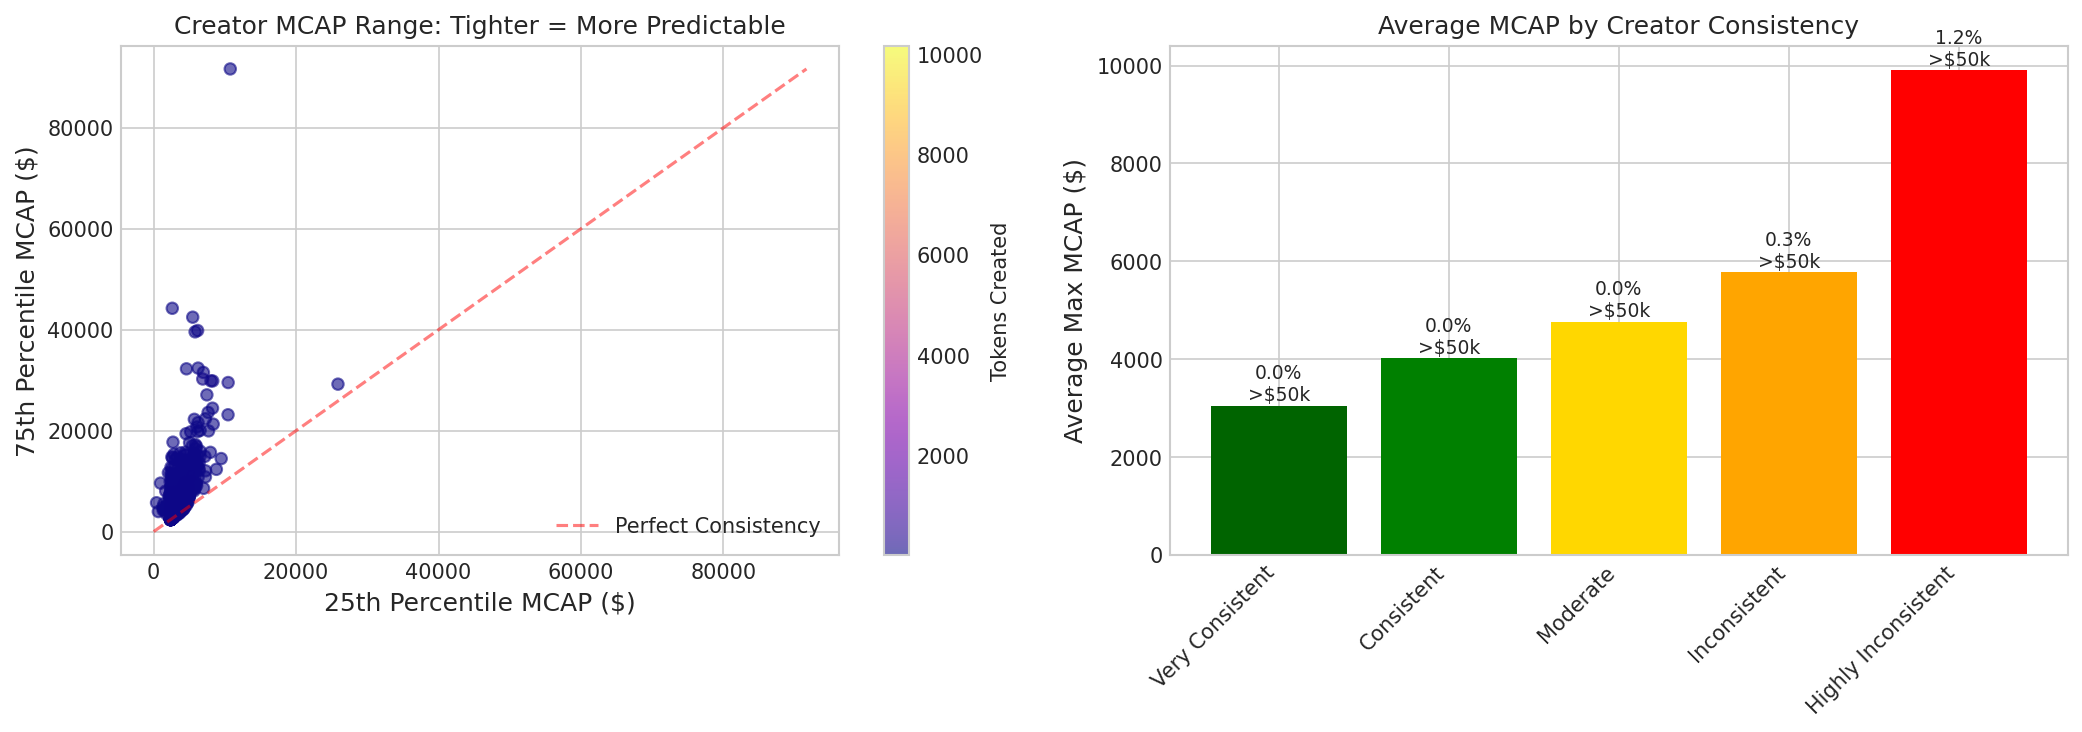
Left plot: Points closer to the diagonal line = more predictable (25th percentile ≈ 75th percentile)
Right plot: The “Highly Inconsistent” group has the highest average MCAP and the highest rate of $50k+ tokens - variance correlates with upside potential.
The Consistency Paradox
Very consistent creators optimize for predictability, not breakouts. They’re likely:
- Running automated/scripted launches
- Targeting a specific MCAP range
- Avoiding variance to maintain consistent returns
Single Creator Deep Dive
Here’s one of the most consistent creators in the dataset:
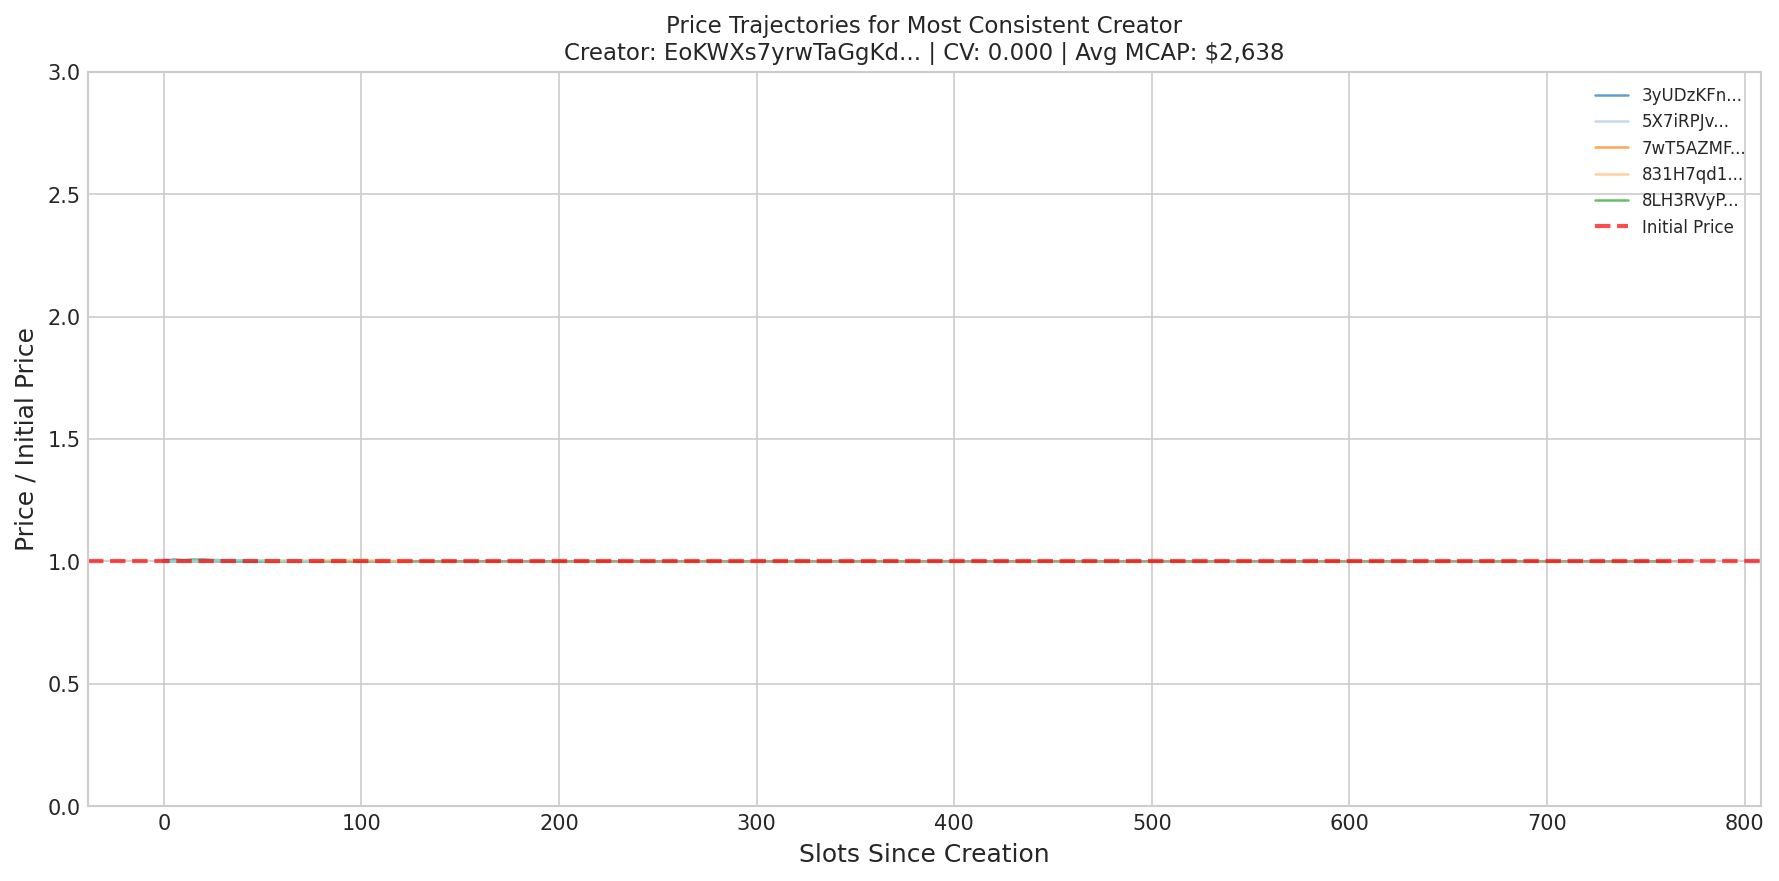
Tokens from consistent creators follow similar trajectories - predictable but limited upside.
High-Value Creators Worth Tracking
Filtering for creators with avg MCAP >= $30k and 10+ tokens:
| Creator | Tokens | Avg MCAP | CV | $100k+ Tokens |
|---|---|---|---|---|
4YP9M4QcF3YA... | 17 | $1.48M | 3.93 | 2 |
AKH84nhYgjgn... | 14 | $620k | 3.41 | 3 |
DeXY2rZVvAbn... | 10 | $358k | 2.76 | 2 |
8KYMfXzpbB6a... | 65 | $221k | 5.58 | 8 |
7BPyhTbWMVBR... | 11 | $206k | 1.21 | 5 |
2igP8NzUZXDv... | 20 | $175k | 2.63 | 4 |
Key observation: The highest MCAP creators have high CV (>2.0) - they produce a mix of moonshots and failures. The exception is 7BPyhTbWMVBR... with CV of 1.21 and 5 tokens above $100k - relatively consistent at high levels.
Strategy implication:
- For moonshot hunting: Track high-avg/high-CV creators (accept variance)
- For consistent exits: Look for rare low-CV creators with high avg MCAP
Trading Implications
For Buyers
- Use creator history for exit targets: If a creator’s tokens historically peak at $50k MCAP, set your take-profit there
- Avoid chasing on consistent creators: They won’t produce surprise breakouts
- Look for inconsistent creators if hunting for 10x+ moonshots (but accept higher variance)
For Sellers/Creators
- Consistency correlates with lower ceiling: Optimizing for predictability caps upside
- Market knows your pattern: After 50+ launches, your expected MCAP is priced in
Risk Management
- Track creator CV before buying their tokens
- Set exit prices based on historical p75 MCAP for that creator
- 577 creators have produced $100k+ tokens - focus on this subset
Code Samples
Query Creator Statistics
from core.clickhouse import ClickHouseAccessor

with ClickHouseAccessor() as db:
    df = db.query_df("""
        SELECT
            toString(c.creator) as creator,
            COUNT(*) as tokens_created,
            AVG(m.max_mcap_usdc) as avg_mcap,
            stddevPop(m.max_mcap_usdc) / AVG(m.max_mcap_usdc) as cv
        FROM pumpfun_token_creation c
        JOIN max_caps m ON toString(c.mint) = m.token_mint
        WHERE c.block_time >= '2026-03-01'
        GROUP BY toString(c.creator)
        HAVING COUNT(*) >= 5
        ORDER BY cv ASC
        LIMIT 20
    """)
    print(df)
Find High-Value Creators
# Filter for creators with meaningful MCAP (>$30k avg)
high_value = df[df['avg_mcap'] >= 30000]
print(f"Found {len(high_value)} high-value creators")

# Sort by tokens above $100k
high_value_sorted = high_value.sort_values('tokens_above_100k', ascending=False)
print(high_value_sorted.head(20))
Get Price Evolution Data
query = """
WITH creator_tokens AS (
    SELECT mint, slot as creation_slot
    FROM pumpfun_token_creation
    WHERE toString(creator) = %(creator)s
      AND block_time >= '2026-03-15'
    LIMIT 10
)
SELECT
    toString(s.base_coin) as token,
    s.slot - ct.creation_slot as slots_since_creation,
    toFloat64(s.virtual_sol_balance_after) /
        toFloat64(s.virtual_token_balance_after) as price
FROM pumpfun_all_swaps s
JOIN creator_tokens ct ON toString(s.base_coin) = toString(ct.mint)
WHERE s.slot >= ct.creation_slot
  AND s.slot <= ct.creation_slot + 1000
ORDER BY token, slots_since_creation
"""

df = db.query_df(query, parameters={"creator": creator_address})
Conclusions
- 98% of prolific creators produce tokens that never reach tradeable MCAP (>$30k)
- Only 207 creators (2.1%) consistently produce tradeable tokens
- 577 creators have produced $100k+ tokens - this is your focus list
- High-ceiling creators have high variance: The $500k+ avg MCAP creators have CV > 2.0
- Actionable strategy: Track the 207 “meaningful” creators; use their historical pattern (consistent vs volatile) to set position sizing and exit targets
The Real Alpha
Most Pumpfun analysis focuses on the wrong question (“which tokens will moon?”). The better question is: which creators produce tradeable tokens at all? By filtering to the 2% who do, you dramatically improve your odds before even looking at individual tokens.
Data from max_caps + pumpfun_token_creation tables. Analysis period: March 2026.