Two tables landed in our indexers this week. Each one unlocks a question the previous schema could not answer.
- Solana —
pumpfun_v2_swaps: tracks Pumpfun’s v2 swap surface, with an explicitquote_coincolumn and afailedflag (the oldpumpfun_all_swapsonly stored successful swaps and assumed SOL quote). - Polygon —
polymarket.raw_event_meta: stores Polymarket’s event metadata — the parent object above markets — including the rich tag taxonomy used in the frontend.
This post walks through three concrete questions the new columns make answerable, with SQL you can copy and plots from the last 24-48 hours of live data.
1. WSOL vs USDC quote volume on Pumpfun v2
pumpfun_all_swaps always implied a SOL quote — the column was literally named virtual_sol_balance_after. Pumpfun v2 supports USDC-quoted markets, so the new pumpfun_v2_swaps table carries quote_coin explicitly. Distinct values in the last 18 months:
| quote_coin | rows |
|---|---|
So11111111111111111111111111111111111111112 (WSOL) | 647,628 |
EPjFWdd5AufqSSqeM2qN1xzybapC8G4wEGGkZwyTDt1v (USDC) | 78,350 |
| other | 5 |
To compare the two on a single scale, we value WSOL at a fixed $85/SOL:
SELECT
    toStartOfHour(block_time) AS h,
    quote_coin,
    sum(quote_coin_amount) AS atomic_amount
FROM pumpfun_v2_swaps
WHERE failed = 0
  AND block_time >= now() - INTERVAL 24 HOUR
  AND quote_coin IN (
    'So11111111111111111111111111111111111111112',  -- WSOL, 9 decimals
    'EPjFWdd5AufqSSqeM2qN1xzybapC8G4wEGGkZwyTDt1v'  -- USDC, 6 decimals
  )
GROUP BY h, quote_coin
ORDER BY h
Then in Python, convert each row to USD (atomic / 1e9 * 85 for WSOL, atomic / 1e6 for USDC):
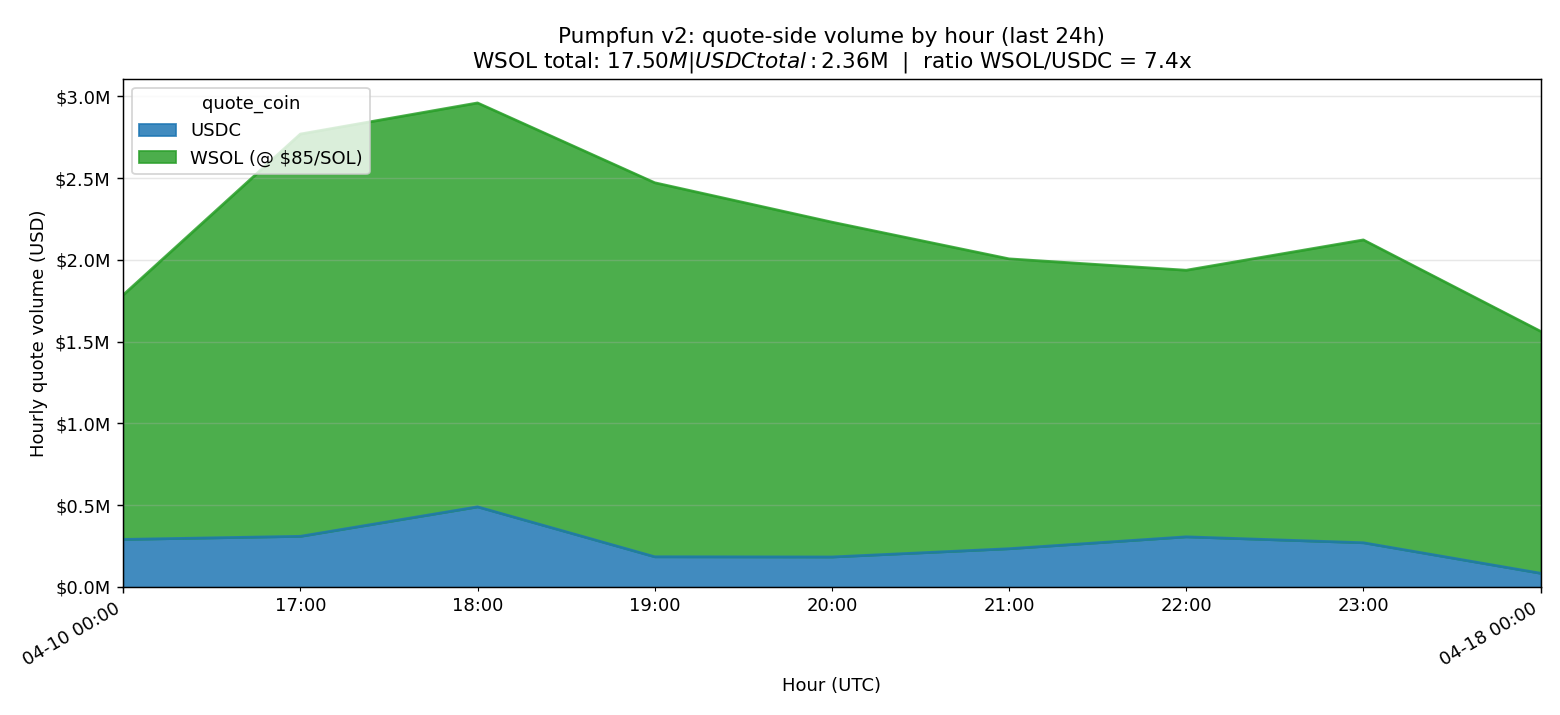
24h totals: WSOL $17.5M vs USDC $2.4M — WSOL routes about 7.4× more notional value than USDC on Pumpfun v2 right now. USDC quote exists, but it is the minority pair, not the centerpiece.
2. Failed vs successful transactions per hour, per quote
The failed flag is the second new column we care about. The old table silently dropped failed swap attempts, which is fine for “what got executed” but useless for “what tried to execute.” With pumpfun_v2_swaps, we can finally see the bot/MEV failure surface.
SELECT
    toStartOfHour(block_time) AS h,
    quote_coin,
    countIf(failed = 0) AS ok_tx,
    countIf(failed = 1) AS fail_tx
FROM pumpfun_v2_swaps
WHERE block_time >= now() - INTERVAL 48 HOUR
  AND quote_coin IN (
    'So11111111111111111111111111111111111111112',
    'EPjFWdd5AufqSSqeM2qN1xzybapC8G4wEGGkZwyTDt1v'
  )
GROUP BY h, quote_coin
ORDER BY h
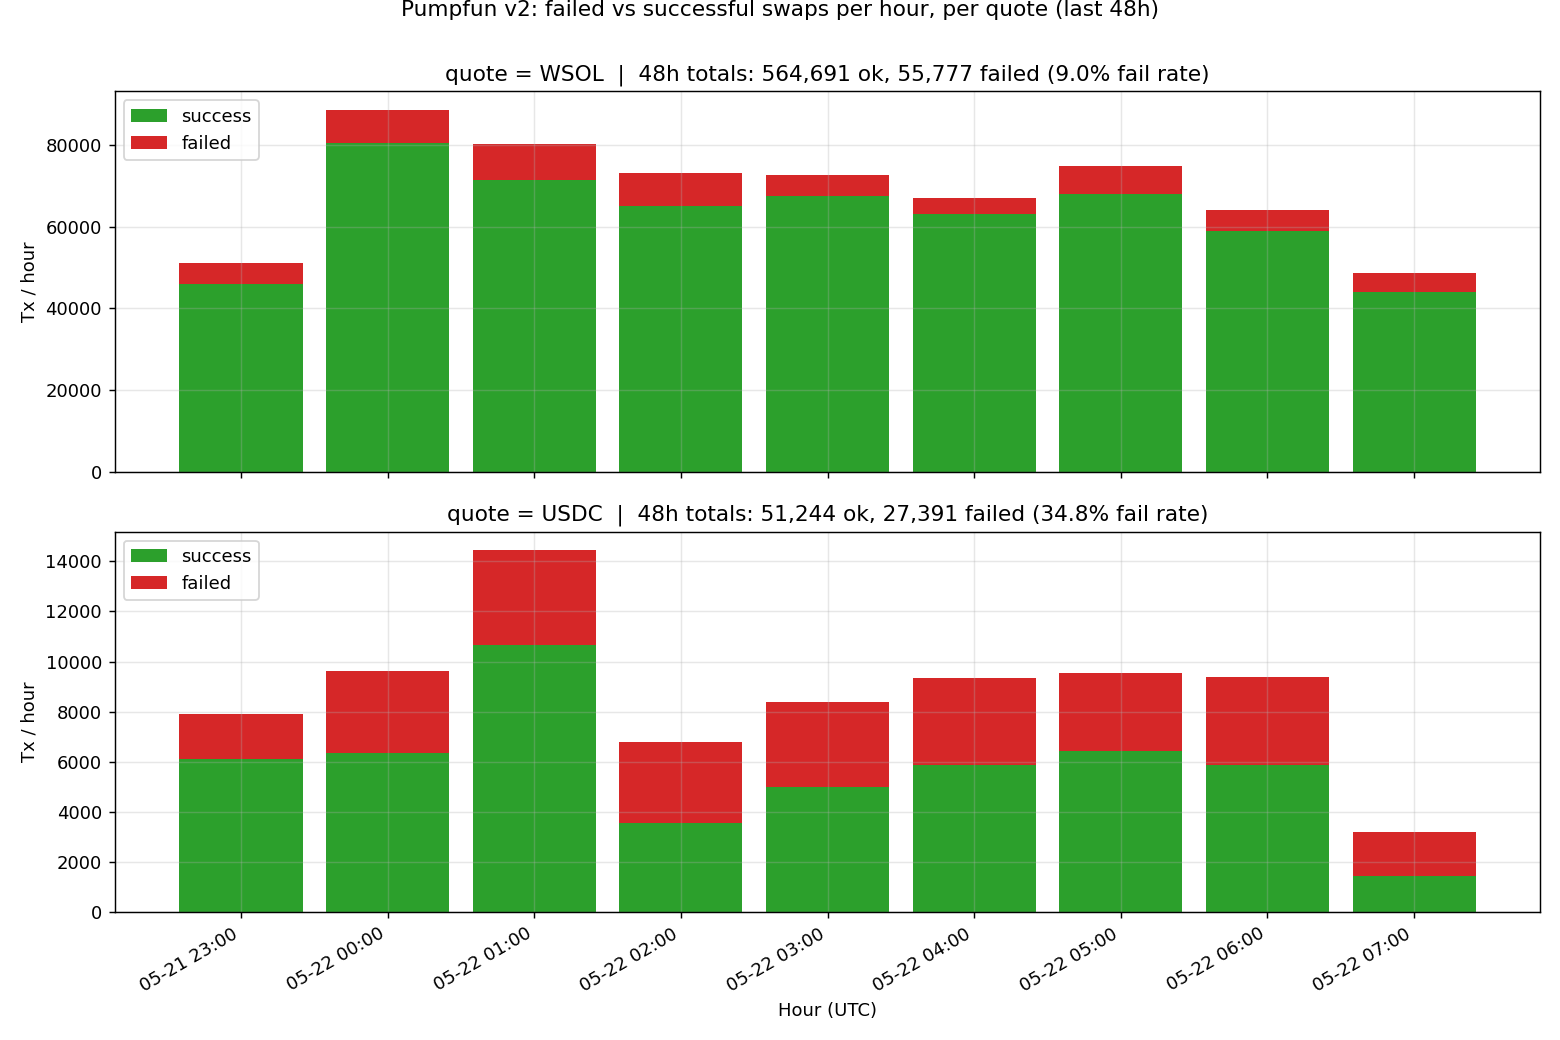
48h headline numbers:
| quote | ok tx | failed tx | fail rate | unique wallets |
|---|---|---|---|---|
| WSOL | 564,691 | 55,777 | 9.0% | 37,273 |
| USDC | 51,244 | 27,391 | 34.8% | 7,177 |
The USDC quote fails ~4× more often than the WSOL quote. Drilling into instruction_type shows where the failures concentrate:
SELECT
    instruction_type,
    countIf(failed = 0) AS ok,
    countIf(failed = 1) AS fail,
    countIf(failed = 1) * 100.0 / count() AS fail_pct
FROM pumpfun_v2_swaps
WHERE block_time >= now() - INTERVAL 7 DAY
GROUP BY instruction_type
ORDER BY (ok + fail) DESC
| instruction_type | ok | fail | fail % |
|---|---|---|---|
sell | 206,418 | 20,619 | 9.1% |
buy | 194,575 | 14,914 | 7.1% |
buy_exact_quote_in_v2 | 60,125 | 34,384 | 36.4% |
sell_v2 | 67,536 | 5,770 | 7.9% |
buy_exact_sol_in | 59,631 | 5,731 | 8.8% |
buy_v2 | 27,650 | 1,755 | 6.0% |
The buy_exact_quote_in_v2 instruction — used for USDC-quoted buys with exact input — accounts for almost all of the elevated failure rate. Without the failed flag and instruction_type we would have written this off as a thin market; the new columns show it is actually a high-attempt, low-success market, with bots burning fees on the v2 instruction path.
3. Polygon: 24h volume per tag
polymarket.raw_event_meta is the parent of raw_market_meta. One event groups several markets (e.g. “World Cup 2026 winner” is one event, each “country wins” is one market). The new table carries the fields the frontend renders: title, category, subcategory, volume_24hr, and — most useful for analytics — a tags JSON array.
A tag entry looks like:
{"id": "100350", "label": "Soccer", "slug": "soccer", ...}
To compute 24h notional volume per tag, we need three joins:
raw_event_meta.tags→ expand the JSON array, one row per (event, tag)raw_market_meta.event(JSON) → extract the event id, linkclob_token_idto the eventpolymarket_order_filled_v3.asset=clob_token_id→ connect fills to events
WITH market_to_event AS (
    SELECT
        clob_token_id,
        JSONExtractString(event, 'id') AS event_id
    FROM polymarket.raw_market_meta
    WHERE event IS NOT NULL AND event != ''
),
tag_per_event AS (
    SELECT
        event_id,
        arrayJoin(
            JSONExtract(assumeNotNull(tags), 'Array(Tuple(label String))')
        ).1 AS tag_label
    FROM polymarket.raw_event_meta
    WHERE notEmpty(tags) AND tags != '[]'
)
SELECT
    tag_label,
    sum(f.amount_usdc) / 1e6 AS volume_usdc,
    count() AS trades
FROM polymarket.polymarket_order_filled_v3 f
INNER JOIN market_to_event m ON f.asset = m.clob_token_id
INNER JOIN tag_per_event   t ON m.event_id = t.event_id
WHERE f.block_timestamp >= now() - INTERVAL 24 HOUR
GROUP BY tag_label
ORDER BY volume_usdc DESC
LIMIT 15
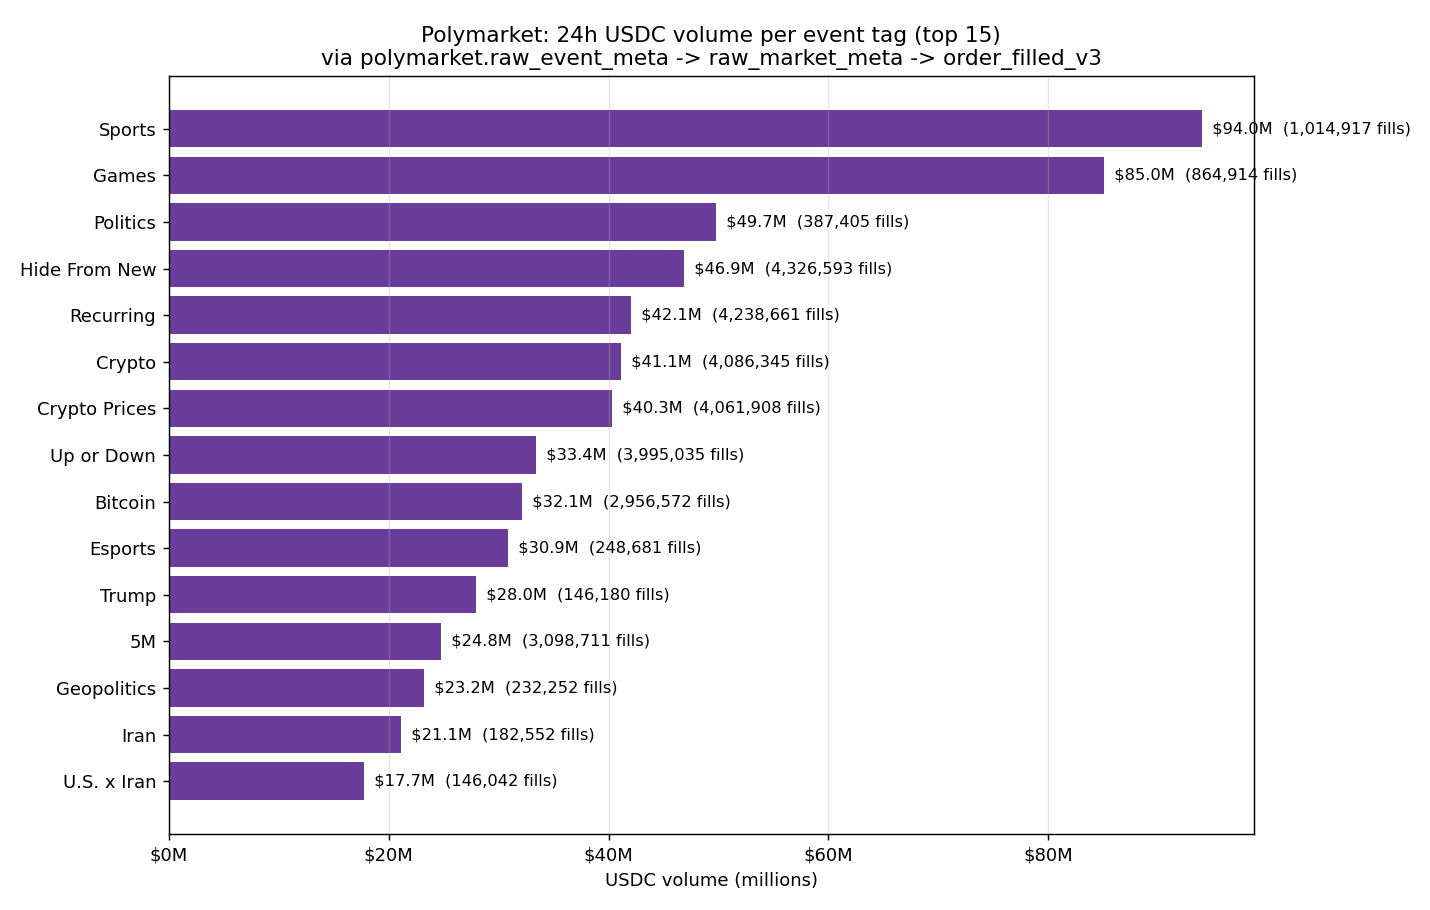
Notes on what shows up:
- Sports ($94M) and Games ($85M) lead. Most of the Games volume is Crypto Prices / Up or Down / 5M — the high-frequency 5-minute price-direction markets, which double-tag as Games and Crypto.
- Politics ($50M) is mostly Trump ($28M) and the Iran-related geopolitics cluster ($21M for Iran + $18M for U.S. x Iran).
- The “Hide From New” tag is internal — Polymarket uses it to keep noisy markets out of their “New” feed. Useful signal that ~$47M of 24h volume is currently in markets the platform is actively de-emphasizing.
Tags overlap (an event can carry several), so the bars do not sum to the global 24h volume — they describe how each tag contributes.
What’s actually new vs. what you already had
| Question | Could you answer it before? | Now |
|---|---|---|
| Total WSOL-quoted Pumpfun volume | yes (via pumpfun_all_swaps) | same, but explicit quote_coin |
| Total USDC-quoted Pumpfun volume | no | pumpfun_v2_swaps with quote_coin = USDC mint |
| Failure rate of Pumpfun swap attempts | no | failed = 1 rows in pumpfun_v2_swaps |
Per-instruction breakdown (buy_v2 vs buy_exact_quote_in_v2, …) | no | instruction_type column |
| Polymarket volume by category | yes (via raw_market_meta.category) | same |
| Polymarket volume by tag (UI taxonomy) | no | raw_event_meta.tags |
| Event-level Polymarket aggregates (open interest, comment count, neg-risk flag) | no | raw_event_meta |
Try it yourself
Both tables are accessible through the standard accessors:
from core.clickhouse import ClickHouseAccessor, PolymarketAccessor

# Solana
with ClickHouseAccessor() as db:
    df = db.query_df("SELECT * FROM pumpfun_v2_swaps LIMIT 5")

# Polygon
with PolymarketAccessor() as db:
    df = db.query_df("SELECT event_id, title, tags FROM polymarket.raw_event_meta LIMIT 5")
Schemas in full: DESCRIBE pumpfun_v2_swaps and DESCRIBE polymarket.raw_event_meta.
The script that produced the plots above lives at experiments/new_indexer_tables/01_generate_charts.py in the research repo.
Analysis conducted by Onchain Divers.
Connect with us:
- Website: onchaindivers.com
- Twitter: @parrotexplore
- Discord: Join our community