When a new token launches on Pumpfun, the first few slots are a battleground. Bots compete to be first, snipers pay premium priority fees, and landing fees, and the early price action often determines whether a token moons or dies.
But does paying higher landing fees actually correlate with token success?
We analyzed 138,481 Pumpfun token launches from the past 7 days, tracking over 1.2 million swaps in the first 10 slots after each launch. The results reveal a surprisingly strong relationship between early fee competition and price performance.
Key Findings
- Spearman correlation: 0.447 - Strong positive relationship between total landing fees and max price
- Log-log correlation: 0.308 - The relationship follows a power law distribution
- Median langing fee per token: 0.014 SOL in first 10 slots
- Some tokens saw up to 26.5 SOL in total landing fees early on
The Data
We pulled two datasets from our ClickHouse database:
- Token Launches: All tokens created on Pumpfun in the last 7 days (179,773 total)
- Early Swaps: All swaps occurring in the first 10 slots after each token’s creation slot
Data Collection Query
Here’s how we fetched the early swap data:
WITH token_launches AS (
    SELECT
        mint,
        slot as creation_slot
    FROM pumpfun_token_creation
    WHERE block_time >= now() - INTERVAL 7 DAY
)
SELECT
    s.base_coin as mint,
    s.slot,
    s.signing_wallet,
    s.direction,
    s.base_coin_amount,
    s.quote_coin_amount,
    s.top_level_transfers_json,
    t.creation_slot,
    s.slot - t.creation_slot as slots_after_launch,
    s.fee
FROM pumpfun_all_swaps s
INNER JOIN token_launches t ON s.base_coin = t.mint
WHERE s.slot >= t.creation_slot
    AND s.slot < t.creation_slot + 10
ORDER BY s.base_coin, s.slot
This gave us 1,203,014 swaps across 167,471 tokens that had trading activity in their first 10 slots.
Extracting Landing Fees
On Solana, landing fees appear primarily as transfers in the top_level_transfers_json field. We extracted total fees paid per token:
import json

def extract_total_lamports(transfers_json: str) -> int:
    """Extract total lamports from top_level_transfers_json."""
    if not transfers_json or transfers_json == '[]':
        return 0
    try:
        transfers = json.loads(transfers_json)
        total = 0
        for t in transfers:
            lamports = t.get('lamports', 0)
            # Handle string or int values
            if isinstance(lamports, str):
                total += int(lamports)
            else:
                total += lamports
        return total
    except (json.JSONDecodeError, TypeError, ValueError):
        return 0
Calculating Max Price
For each swap, we calculated price as the ratio of SOL to tokens:
def calculate_price(row) -> float:
    """Calculate price as quote/base (SOL per token)."""
    if row['base_coin_amount'] == 0:
        return 0
    return row['quote_coin_amount'] / row['base_coin_amount']
We then took the maximum price observed across all early swaps for each token.
The Results
Landing Fees vs Max Price
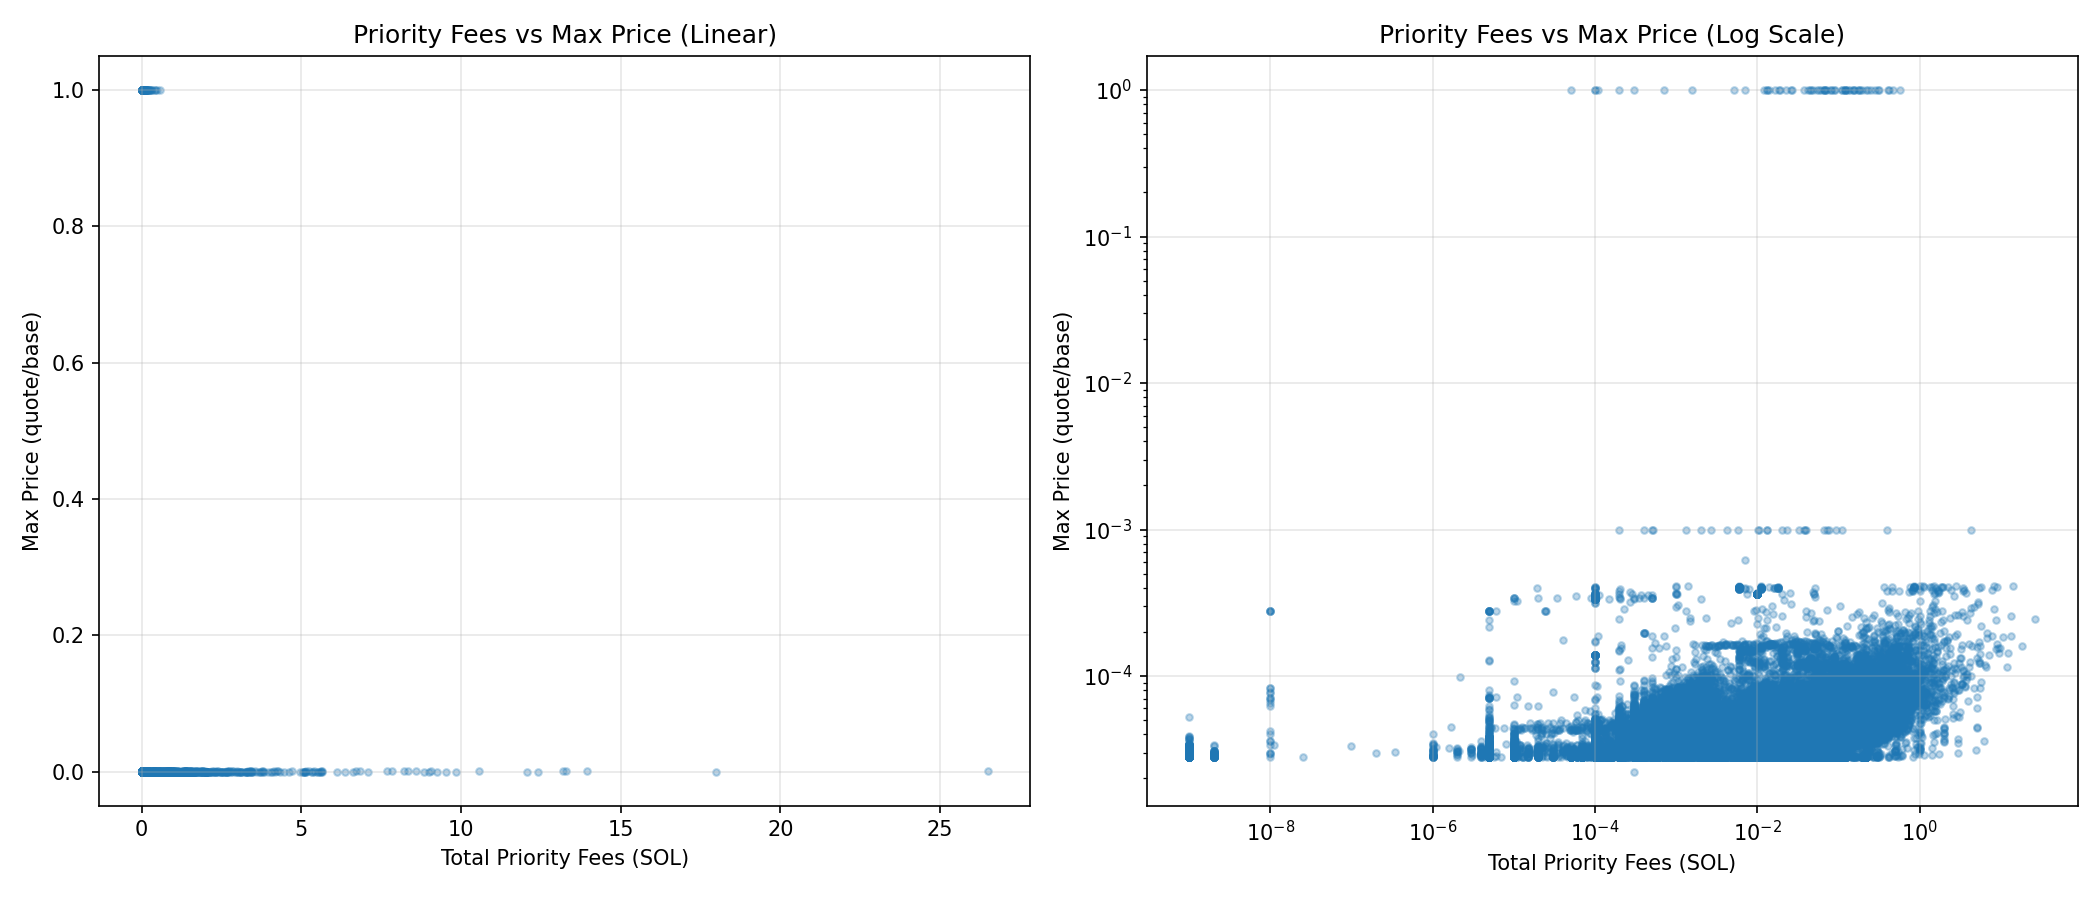
The scatter plots tell the story:
Linear Scale (Left): Most data clusters at low fees and low prices, with outliers achieving high prices.
Log Scale (Right): The relationship becomes clear - there’s a distinct positive correlation. Tokens with higher total landing fees tend to achieve higher maximum prices.
Statistics
| Metric | Value |
|---|---|
| Tokens analyzed | 138,481 |
| Min fee | 0.000001 SOL |
| Max fee | 26.50 SOL |
| Median fee | 0.014 SOL |
| Mean fee | 0.048 SOL |
Correlation Analysis
We computed three types of correlation to understand the relationship:
| Correlation Type | r-value | p-value | Interpretation |
|---|---|---|---|
| Pearson | 0.007 | 0.01 | Weak linear relationship |
| Spearman | 0.447 | 0.00 | Strong rank correlation |
| Log-Log Pearson | 0.308 | 0.00 | Strong power-law relationship |
The low Pearson but high Spearman correlation indicates that the relationship is monotonic but non-linear. Tokens with higher fees tend to have higher prices, but the relationship isn’t proportional.
Transfer Count Analysis
We also analyzed the number of transfers (rather than total lamports) to see if the count of tip transactions correlates with price:
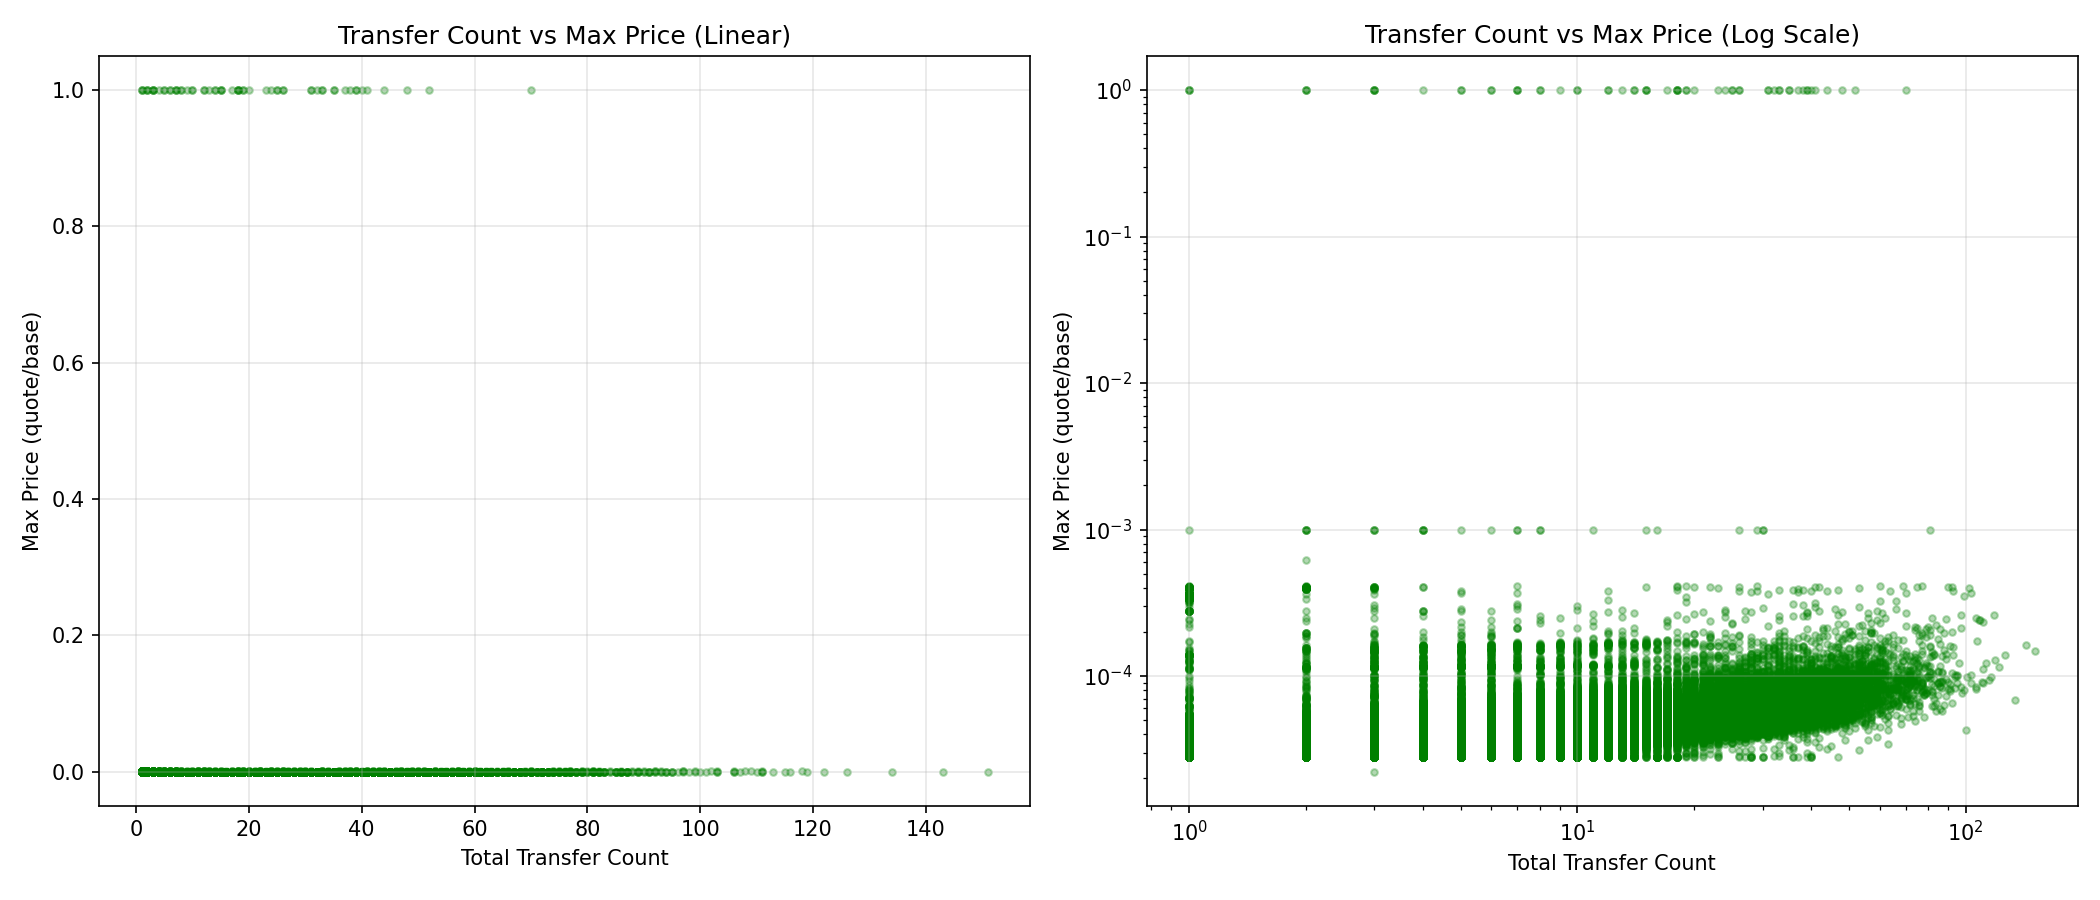
Similar pattern emerges - more transfer activity in early slots correlates with higher max prices. This suggests that the intensity of competition (number of transactions paying tips) is as predictive as the total amount paid.
What This Means
For Traders
- High early fees signal competition - When you see multiple wallets paying premium fees in the first slots, others believe in the token
- It’s not causal - Paying high fees doesn’t cause success; both are symptoms of demand
- Early activity is predictive - The first 10 slots (~4 seconds) contain meaningful signal
For Bot Operators
- Fee wars correlate with opportunity - Tokens worth competing for tend to perform better
- Watch the transfer count - Many small tips may be as meaningful as few large ones
- The relationship is log-linear - 10x more fees doesn’t mean 10x better price
Limitations
This analysis shows correlation, not causation. Possible explanations:
- Demand drives both - Popular tokens attract both high fees AND high prices
- Bot sophistication - Better bots pay more fees AND pick better tokens
- Self-fulfilling prophecy - Early buying pressure from fee-payers drives price up
- Survivor bias - We only see tokens that had trading activity
The Code
Full analysis pipeline:
# Aggregate metrics per token
agg = df.groupby('mint').agg({
    'total_lamports': 'sum',  # Total landing fees
    'price': 'max',           # Max price observed
    'slot': 'count',          # Number of swaps
}).reset_index()

# Convert lamports to SOL
agg['total_fees_sol'] = agg['total_lamports'] / 1e9

# Calculate correlations
from scipy import stats

# Spearman (rank-based, better for non-linear)
spearman_r, spearman_p = stats.spearmanr(
    agg['total_fees_sol'],
    agg['max_price']
)

# Log-log correlation
import numpy as np
log_fees = np.log10(agg['total_fees_sol'])
log_price = np.log10(agg['max_price'])
loglog_r, loglog_p = stats.pearsonr(log_fees, log_price)
Going Deeper: Full Fee Breakdown Per Token
Landing fees are just one part of the picture. Every trade on pump.fun also includes tips to block providers (SWQOS, Jito, Rapid) and DEX protocol fees paid to pump.fun fee recipient accounts. These components are often larger than the landing fee itself.
We built a real-time tracker that captures all three — and exposes them via a simple API:
GET /global-fees?mint=<mint_address>
Example response for token 475LAUKkzj3Vnsv2FG5RJzTMFQKixRNATYnRNfjCpump across 5 transactions:
{
    "mint": "475LAUKkzj3Vnsv2FG5RJzTMFQKixRNATYnRNfjCpump",
    "total": 74380351,
    "transaction_fees": 15348485,
    "base_fees": 30000,
    "priority_fees": 15318485,
    "tips": 21501000,
    "trading_fees": 37530866,
    "tx_count": 5,
    "success_count": 4
}
The total here is 0.074 SOL — compared to 0.016 SOL on GMGN and 0.015 SOL on Axiom for the same token. Both tools count transaction fees only, which is one valid way to look at it. The difference comes from tips (0.0215 SOL) and trading fees (0.0375 SOL) that aren’t captured in meta.fee.
Here’s the full breakdown of where the SOL went across these 5 transactions:
Tips paid to block providers
| Provider | Address | SOL |
|---|---|---|
| Rapid | rapidXMVL... | 0.0100 |
| SWQOS node | Sp1x2Aqp... | 0.0095 |
| Other providers | ENxTEjSQ... | 0.0020 |
Tips vary per transaction and depend on how complete your provider address list is. Different tools cover different sets of providers, which naturally leads to different tip totals.
Trading fees paid to pump.fun protocol
| Recipient | SOL |
|---|---|
3Pvqoztn... | 0.0293 |
G7taW2ME... | 0.0089 |
5hPeX96k... + others | 0.0093 |
On every buy or sell, pump.fun routes a protocol fee to a designated recipient account. These SOL transfers are part of the trade itself rather than the transaction infrastructure, so whether to include them in “fees” is a matter of definition.
If you want to query your own tokens, reach out to @alina_mhrv on Telegram and we’ll share access.
Conclusion
Landing fees in the first 10 slots are a meaningful signal for token performance. With a Spearman correlation of 0.45, this is one of the stronger predictive relationships we’ve found in Pumpfun data.
However, this doesn’t mean you should blindly follow high-fee tokens. The relationship likely reflects underlying demand - tokens that smart money is competing for tend to be tokens worth competing for.
For those building trading systems, incorporating early fee data as a feature could improve token selection. But remember: by the time you observe 10 slots of high-fee activity, you’re already ~4 seconds late to the party.
Data collected from 179,773 Pumpfun launches over 7 days. Analysis code available in our research repository at experiments/priority_fee_price_impact/. Questions? Reach out on Twitter/X or join our Discord.