At exactly 14:39:56 UTC on February 26, 2026, Pumpfun deployed a backwards-incompatible contract update in transaction 3ngCDygaM9hFRcREL6YVjsJoXYfRSMRZ7qQtJuM6ovyZSYoEUo2m7W9u72V1wXKEkJmfbNoBx21qotvatXZJGj4G.
The result? An 82% drop in unique wallets and an 87.5% drop in total swap activity - revealing just how much of Pumpfun’s trading volume comes from automated bots.
Methodology
We analyzed 153,707 swaps from a 3-hour window around the contract update:
- 1.5 hours before (13:09 - 14:39 UTC)
- 1.5 hours after (14:39 - 16:09 UTC)
Data was aggregated into 10-minute intervals to track:
- Unique wallets per interval
- Total SOL volume per interval
- Swap counts per interval
We defined likely “bot wallets” as those executing ≥20 swaps within the 1.5-hour observation period - far beyond typical retail trading patterns.
The Impact: An Instant Market Freeze
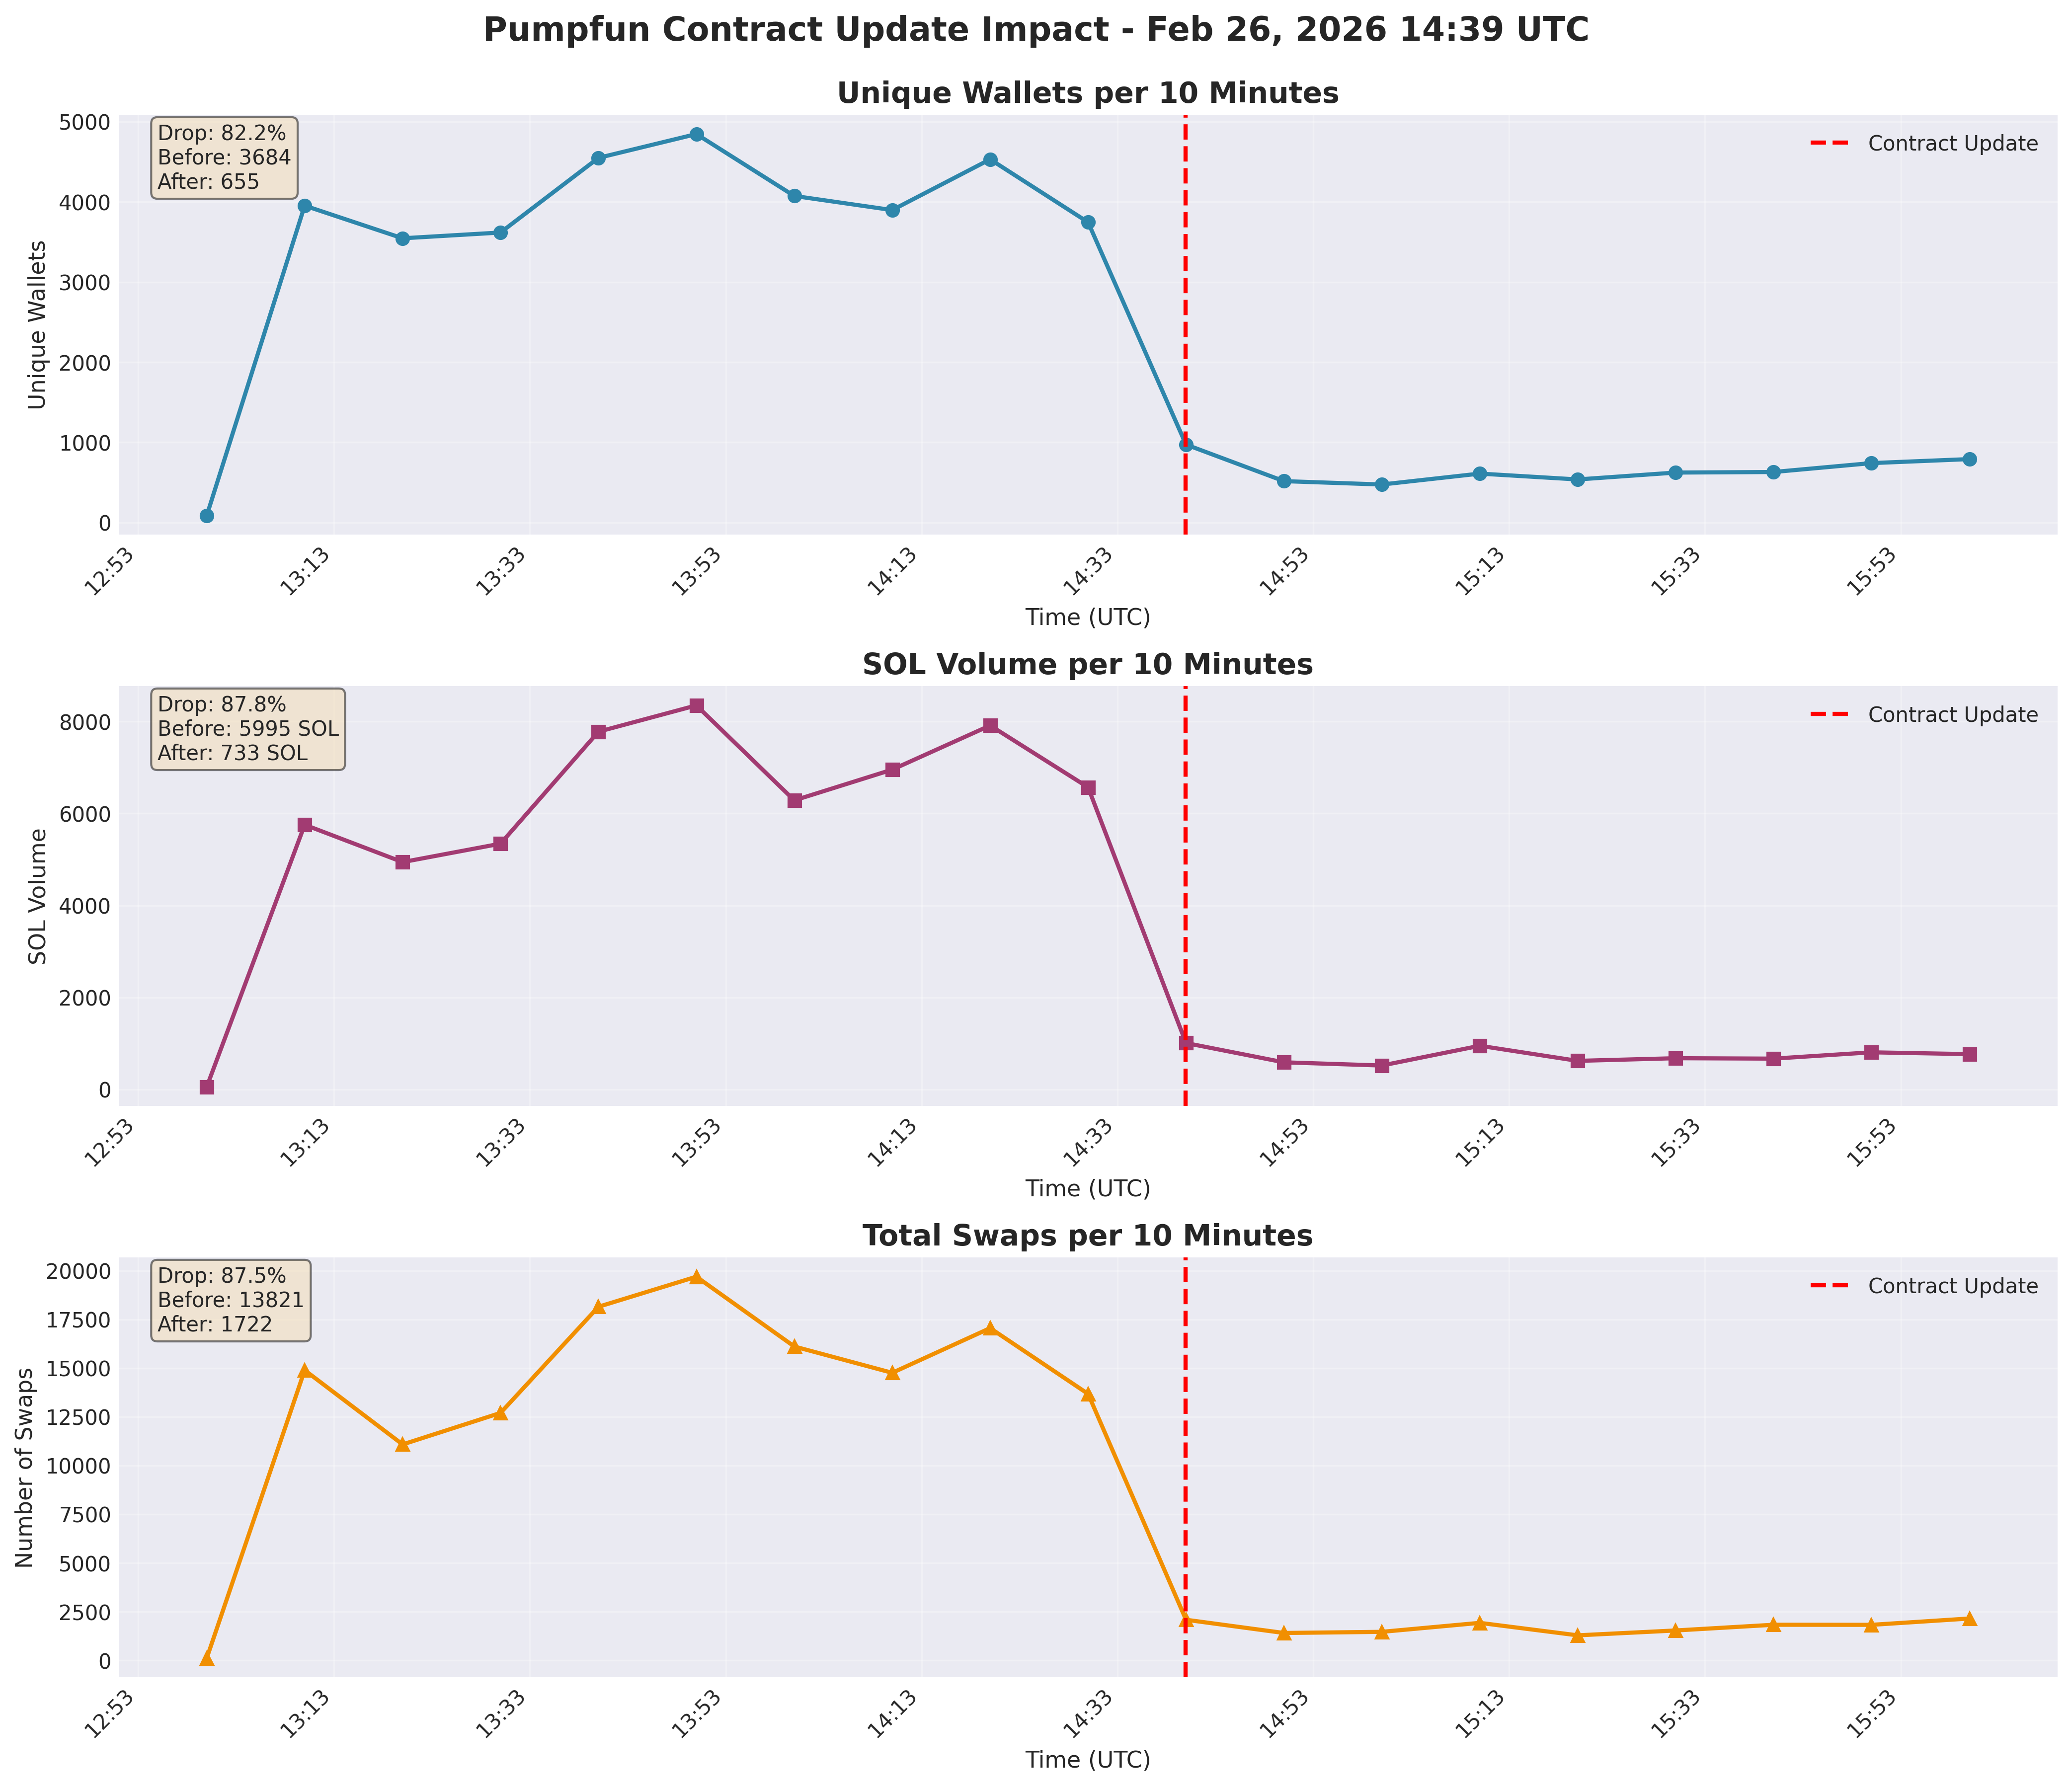
The moment the contract updated, Pumpfun’s market activity fell off a cliff:
| Metric | Before Update | After Update | Change |
|---|---|---|---|
| Avg Unique Wallets (per 10min) | 3,684 | 655 | -82.2% |
| Avg Total Swaps (per 10min) | 13,821 | 1,722 | -87.5% |
| Avg SOL Volume (per 10min) | 3,771 SOL | 743 SOL | -80.3% |
The Numbers Behind the Drop
Before the update (1.5 hours):
- 138,061 total swaps from 16,485 unique wallets
- Average of 8.37 swaps per wallet
- 20.5% of wallets were high-frequency traders (≥10 swaps)
After the update (1.5 hours):
- 15,646 total swaps from 4,029 unique wallets
- Average of 3.88 swaps per wallet
- Only 4.6% of wallets were high-frequency traders
Bot Detection: The 97% Disappearance
Using our threshold of ≥20 swaps in 1.5 hours, we identified likely automated trading bots:
| Period | Bot Wallets | Total Wallets | Bot % |
|---|---|---|---|
| Before | 1,508 | 16,485 | 9.1% |
| After | 40 | 4,029 | 1.0% |
| Change | -97.3% | -75.6% | - |
The contract update didn’t just slow down bots - it eliminated 97.3% of them instantly.
What This Reveals About Market Structure
Before the update, nearly 10% of all active wallets were running automated strategies. These high-frequency bots contributed massive volume:
- High-frequency wallets (≥10 swaps): 20.5% of wallets before → 4.6% after
- Low-frequency wallets (1-2 swaps): 44.8% of wallets before → 68.6% after
The post-update market became dramatically more retail-dominated, with most wallets executing just 1-2 trades.
The Recovery Timeline
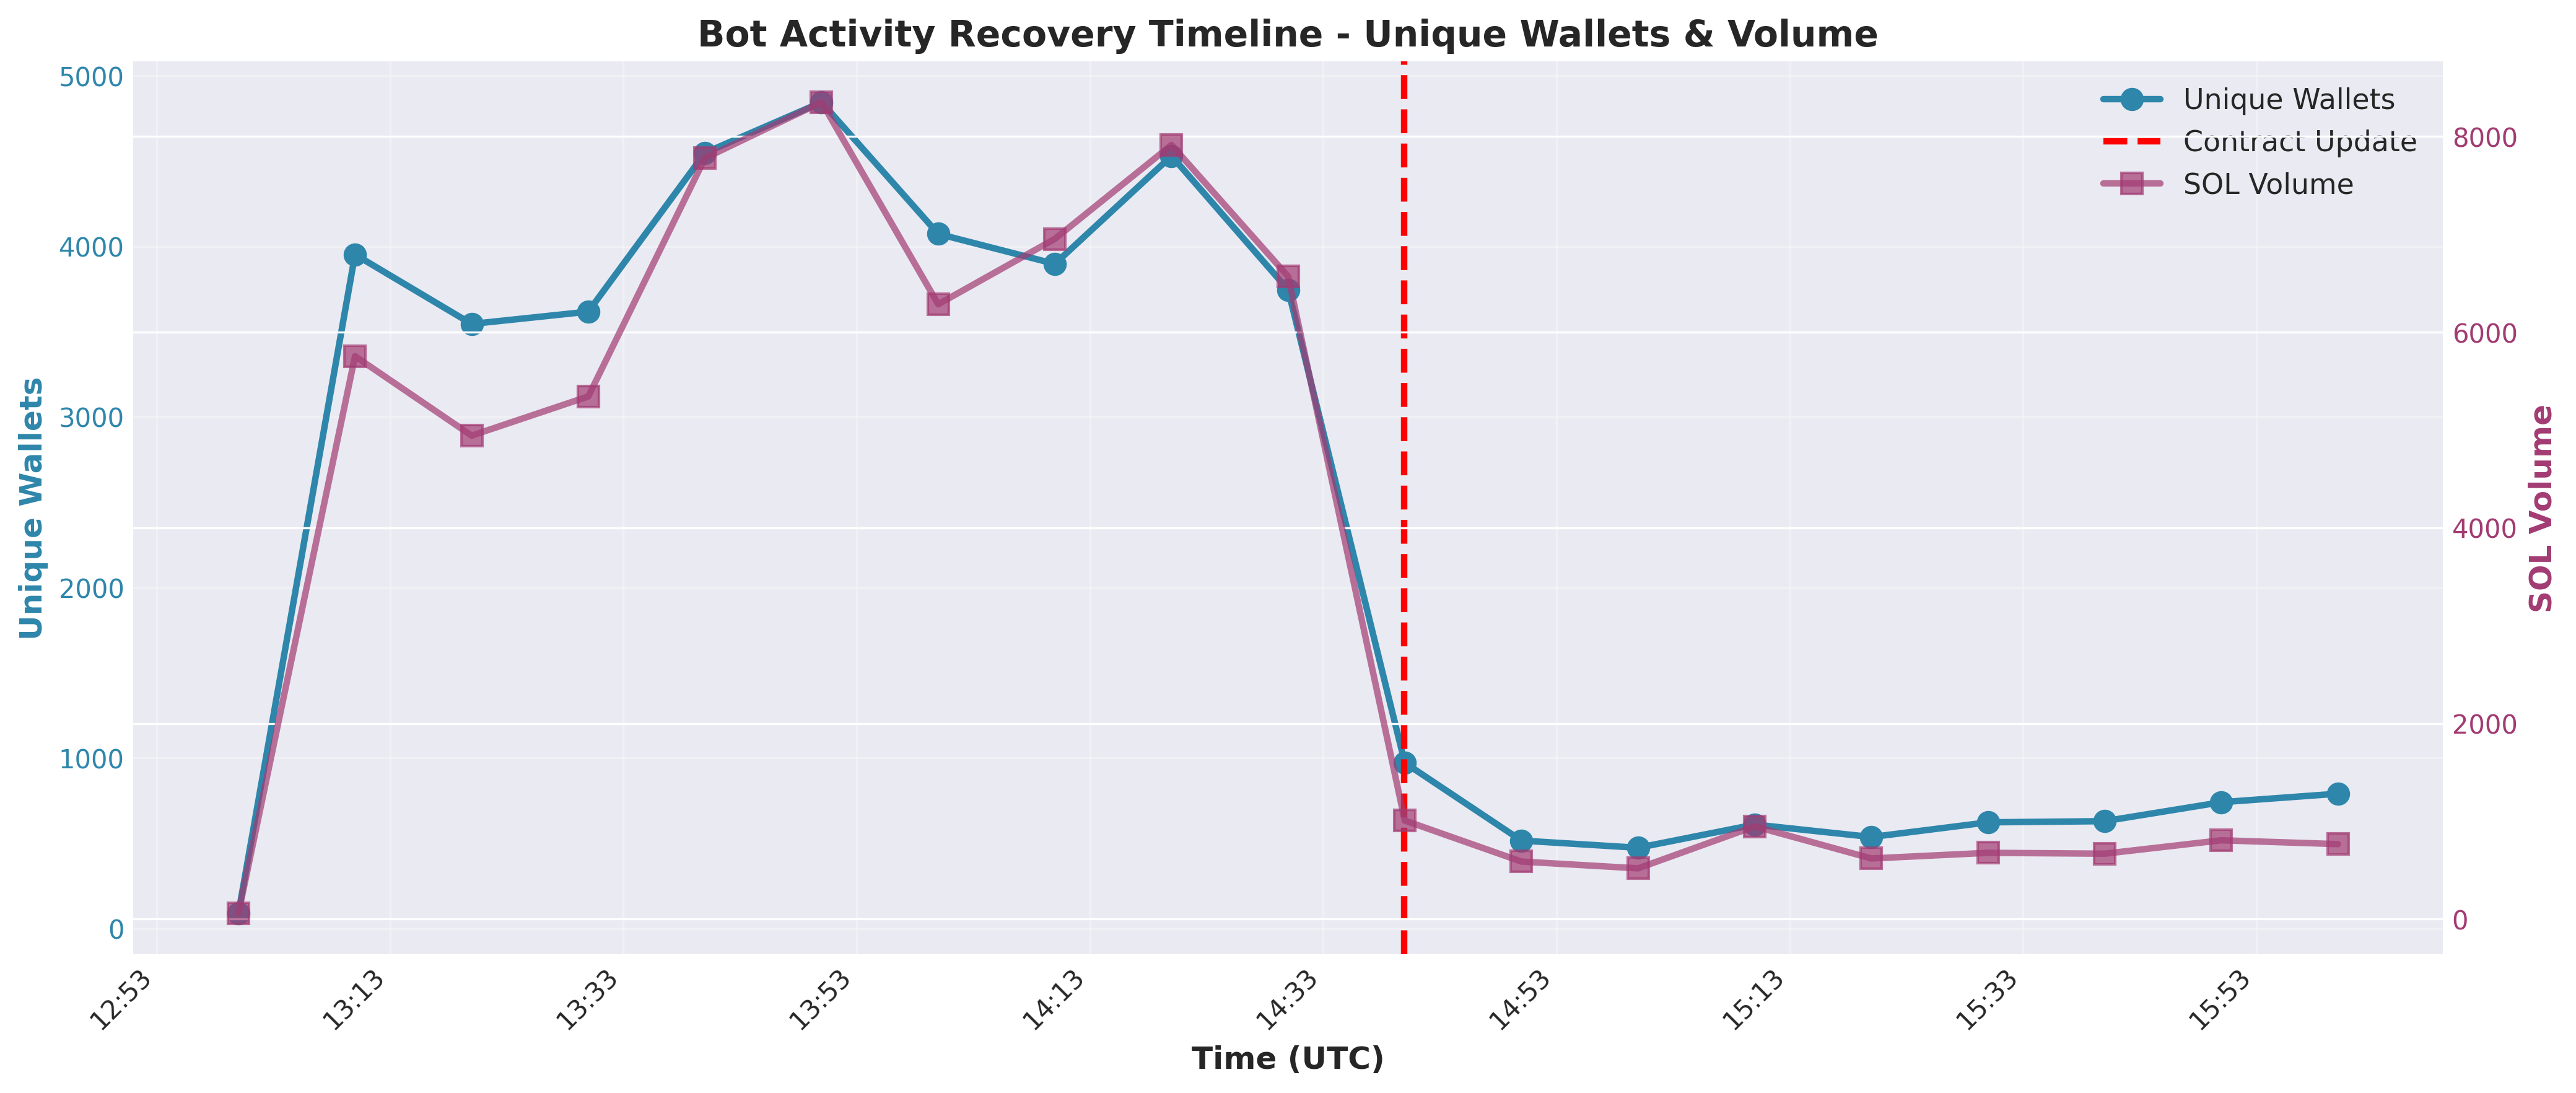
No Recovery Within Observation Window
We tracked whether activity would recover to even 50% of pre-update levels:
Target thresholds (50% of pre-update average):
- Unique wallets: 1,842 per 10 minutes
- Total swaps: 6,911 per 10 minutes
Result: Neither metric reached 50% recovery within the 1.5-hour post-update window.
The First 30 Minutes After Update
| Time After Update | Unique Wallets | Total Swaps | SOL Volume |
|---|---|---|---|
| 0-10 minutes | 972 | 2,084 | 877 SOL |
| 10-20 minutes | 516 | 1,405 | 632 SOL |
| 20-30 minutes | 474 | 1,464 | 713 SOL |
Even in the first 10 minutes (which likely included some delayed pre-update transactions), activity remained at just 26% of pre-update levels for wallets and 15% for swaps.
What Does “Organic Retail Traffic” Look Like?
The post-update period gives us a rare glimpse into what Pumpfun looks like with minimal bot activity:
Swap Size Distribution
Interestingly, swap sizes remained similar before and after:
| Metric | Before Update | After Update |
|---|---|---|
| Mean swap size | 0.4336 SOL | 0.4272 SOL |
| Median swap size | 0.1497 SOL | 0.0988 SOL |
| 75th percentile | 0.5319 SOL | 0.4938 SOL |
| 95th percentile | 1.6688 SOL | 1.7904 SOL |
This suggests bots weren’t using dramatically different position sizes than retail traders - they were just trading far more frequently.
Wallet Behavior Patterns
Before update:
- Median swaps per wallet: 3
- Mix of bot and retail activity
- High concentration of volume in high-frequency wallets
After update:
- Median swaps per wallet: 2
- Primarily retail behavior
- More evenly distributed activity across wallets
The post-update market shows what genuine retail trading looks like: lower frequency, more distributed, less coordinated.
Key Findings
1. Bots Dominated Pre-Update Activity
With a 97.3% reduction in bot wallets and an 87.5% drop in total swaps, it’s clear that automated trading was the primary driver of Pumpfun’s market activity.
2. Bots Did Not Quickly Adapt
Unlike many DeFi protocol updates where bots adapt within minutes, Pumpfun’s backwards-incompatible contract change kept bot activity suppressed for at least 1.5 hours - likely longer.
The contract-level change required code updates, redeployment, and testing - not just parameter adjustments.
3. Retail Traders Continued Trading
Despite the 82% drop in unique wallets, thousands of retail traders continued swapping. The 4,029 wallets active post-update represent genuine human traders who navigated the new contract interface.
4. Volume Concentration in Automated Strategies
The dramatic volume drop (80.3% reduction in SOL volume) shows that bot wallets weren’t just trading frequently - they were moving significant capital.
5. Market Structure Changed Fundamentally
The shift from 20.5% high-frequency wallets to just 4.6% indicates a complete transformation in market dynamics:
- Before: Bot-dominated, high-velocity trading
- After: Retail-dominated, lower-frequency activity
Implications
For Traders
- Bot presence is massive: Under normal conditions, ~10% of active wallets are bots
- Volume is deceptive: Much of Pumpfun’s volume comes from automated strategies
- Organic activity exists: Thousands of retail traders continue trading regardless
For Bot Operators
- Contract updates are disruptive: Backwards-incompatible changes require significant rework
- Recovery takes time: Not all bots adapted within 1.5 hours
- Competition is fierce: 1,508 automated wallets were competing before the update
For Researchers
- Contract updates as natural experiments: Protocol changes reveal underlying market structure
- Bot detection via behavior: High-frequency trading (≥20 swaps/1.5h) is a strong signal
- Volume decomposition matters: Raw volume metrics mask the bot vs retail split
Technical Details
Data Sources
- Swap data: Pumpfun on-chain transactions from ClickHouse
- Time window: Feb 26, 2026 13:09:56 - 16:09:56 UTC (3 hours)
- Total swaps analyzed: 153,707
- Unique wallets: 18,616
Bot Classification
We classified wallets as “likely bots” using a frequency-based heuristic:
- Threshold: ≥20 swaps in 1.5 hours
- Rationale: ~13 swaps/hour is beyond typical retail behavior
- Conservative estimate: True bot count likely higher
Analysis Code
All analysis code is available in our research repository:
01_download_data.py- ClickHouse data extraction02_calculate_metrics.py- 10-minute interval aggregation03_generate_charts.py- Visualization generation04_analyze_bot_recovery.py- Bot detection and recovery analysis
Repository: w3e-research/experiments/pumpfun_contract_update_feb26
Conclusion
The February 26 Pumpfun contract update provided a rare natural experiment: what happens when you remove 97% of the bots from a DeFi protocol?
The answer: trading volume collapses by 87.5%, revealing that automated strategies drive the vast majority of Pumpfun’s apparent activity.
While thousands of retail traders continued swapping tokens, the market fundamentally changed character - from high-velocity, bot-dominated to low-frequency, retail-dominated.
For anyone analyzing DeFi metrics, this serves as a stark reminder: raw volume numbers mask the underlying bot vs retail composition. The “real” market may be far smaller than on-chain volume suggests.
Analysis conducted by Onchain Divers using on-chain Pumpfun transaction data.
Connect with us:
- Website: onchaindivers.com
- Twitter: @parrotexplore
- Discord: Join our community