A question that haunts every Solana trader: Are validators ordering transactions fairly?
In a fair system, transactions should be ordered roughly by when they arrive (FIFO) or randomly. But validators have the power to reorder transactions within their blocks - potentially front-running users, back-running profitable trades, or systematically disadvantaging certain transaction types.
We analyzed 27,000 recent Solana blocks (~3 hours of network activity) containing 34+ million transactions from 600+ unique validators to answer this question. We tracked not just success/failure status, but also Jito tip transactions and nonce advance transactions - two key indicators of sophisticated block building and MEV activity.
The Topological Map: Visualizing Block Structure
Before diving into statistics, let’s see what Solana blocks actually look like. This topological map shows 100 consecutive blocks, with each row representing a block and each pixel representing a transaction:
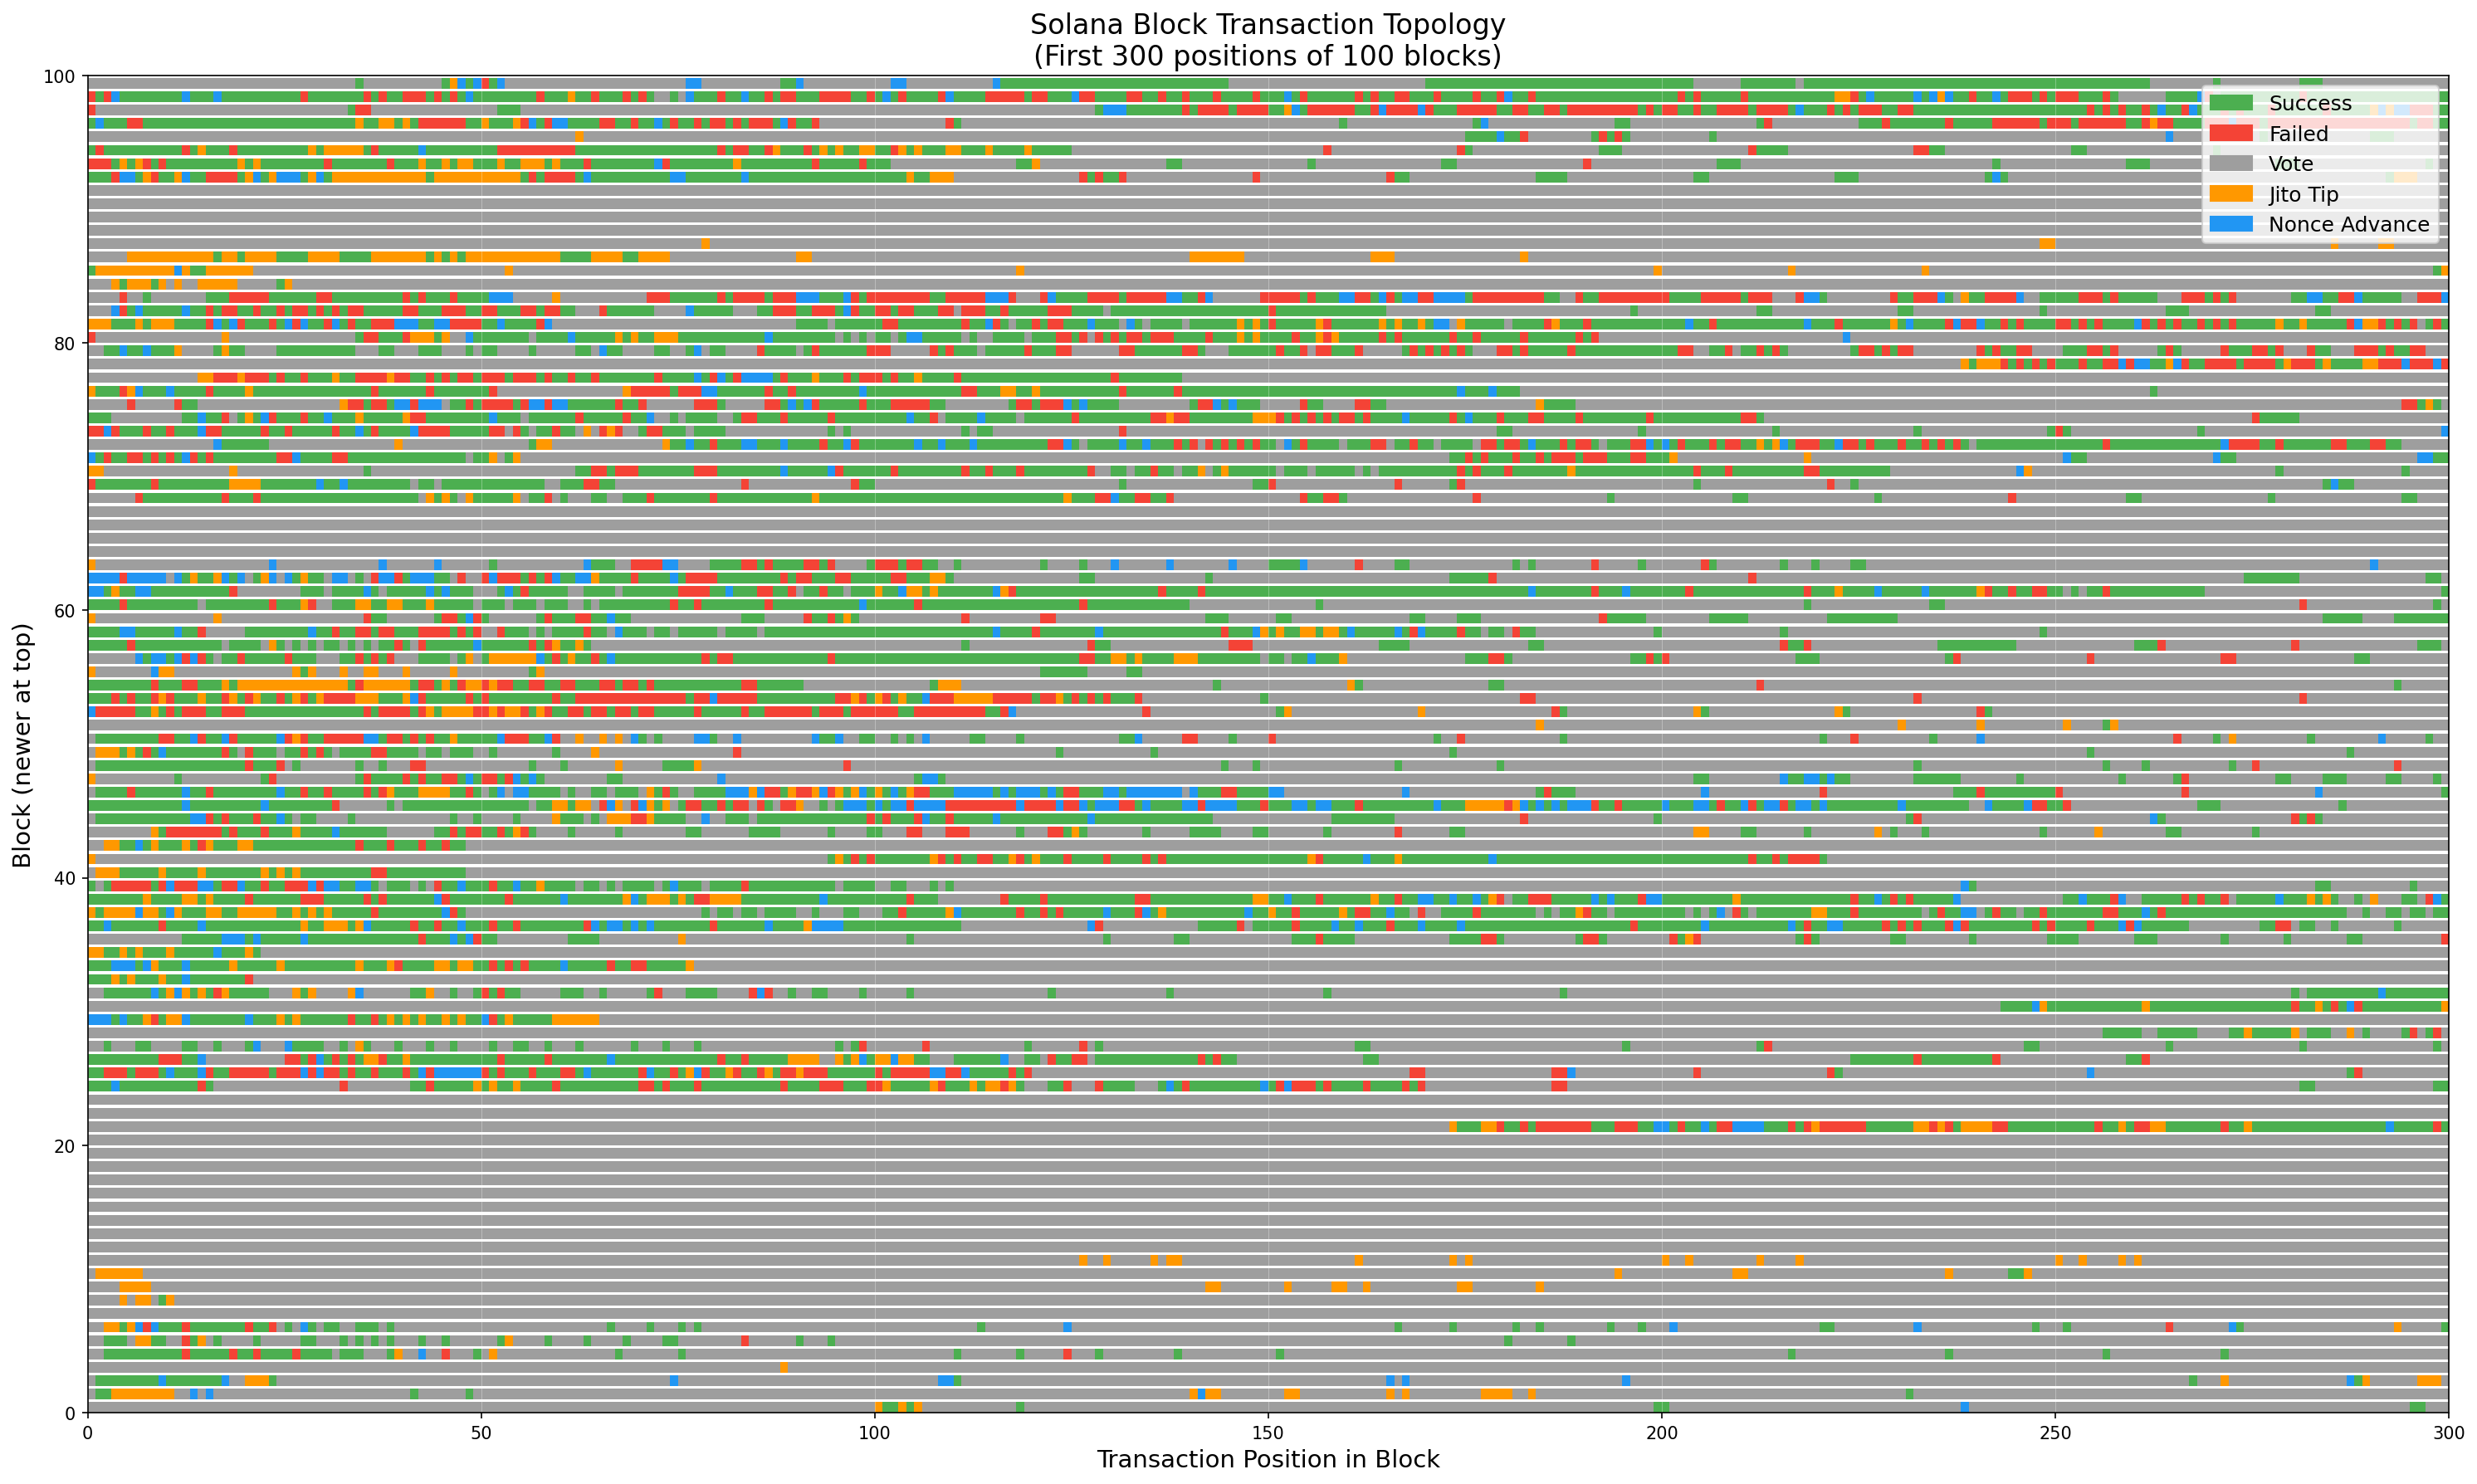
Color Legend:
- 🟢 Green: Successful transactions
- 🔴 Red: Failed transactions
- 🟠 Orange: Jito tip transactions (MEV bundles)
- 🔵 Blue: Nonce advance transactions (durable transactions)
- ⚪ Gray: Vote transactions
Zoomed View: Block Start Detail
The first 50 positions are particularly interesting - this is where priority transactions compete:
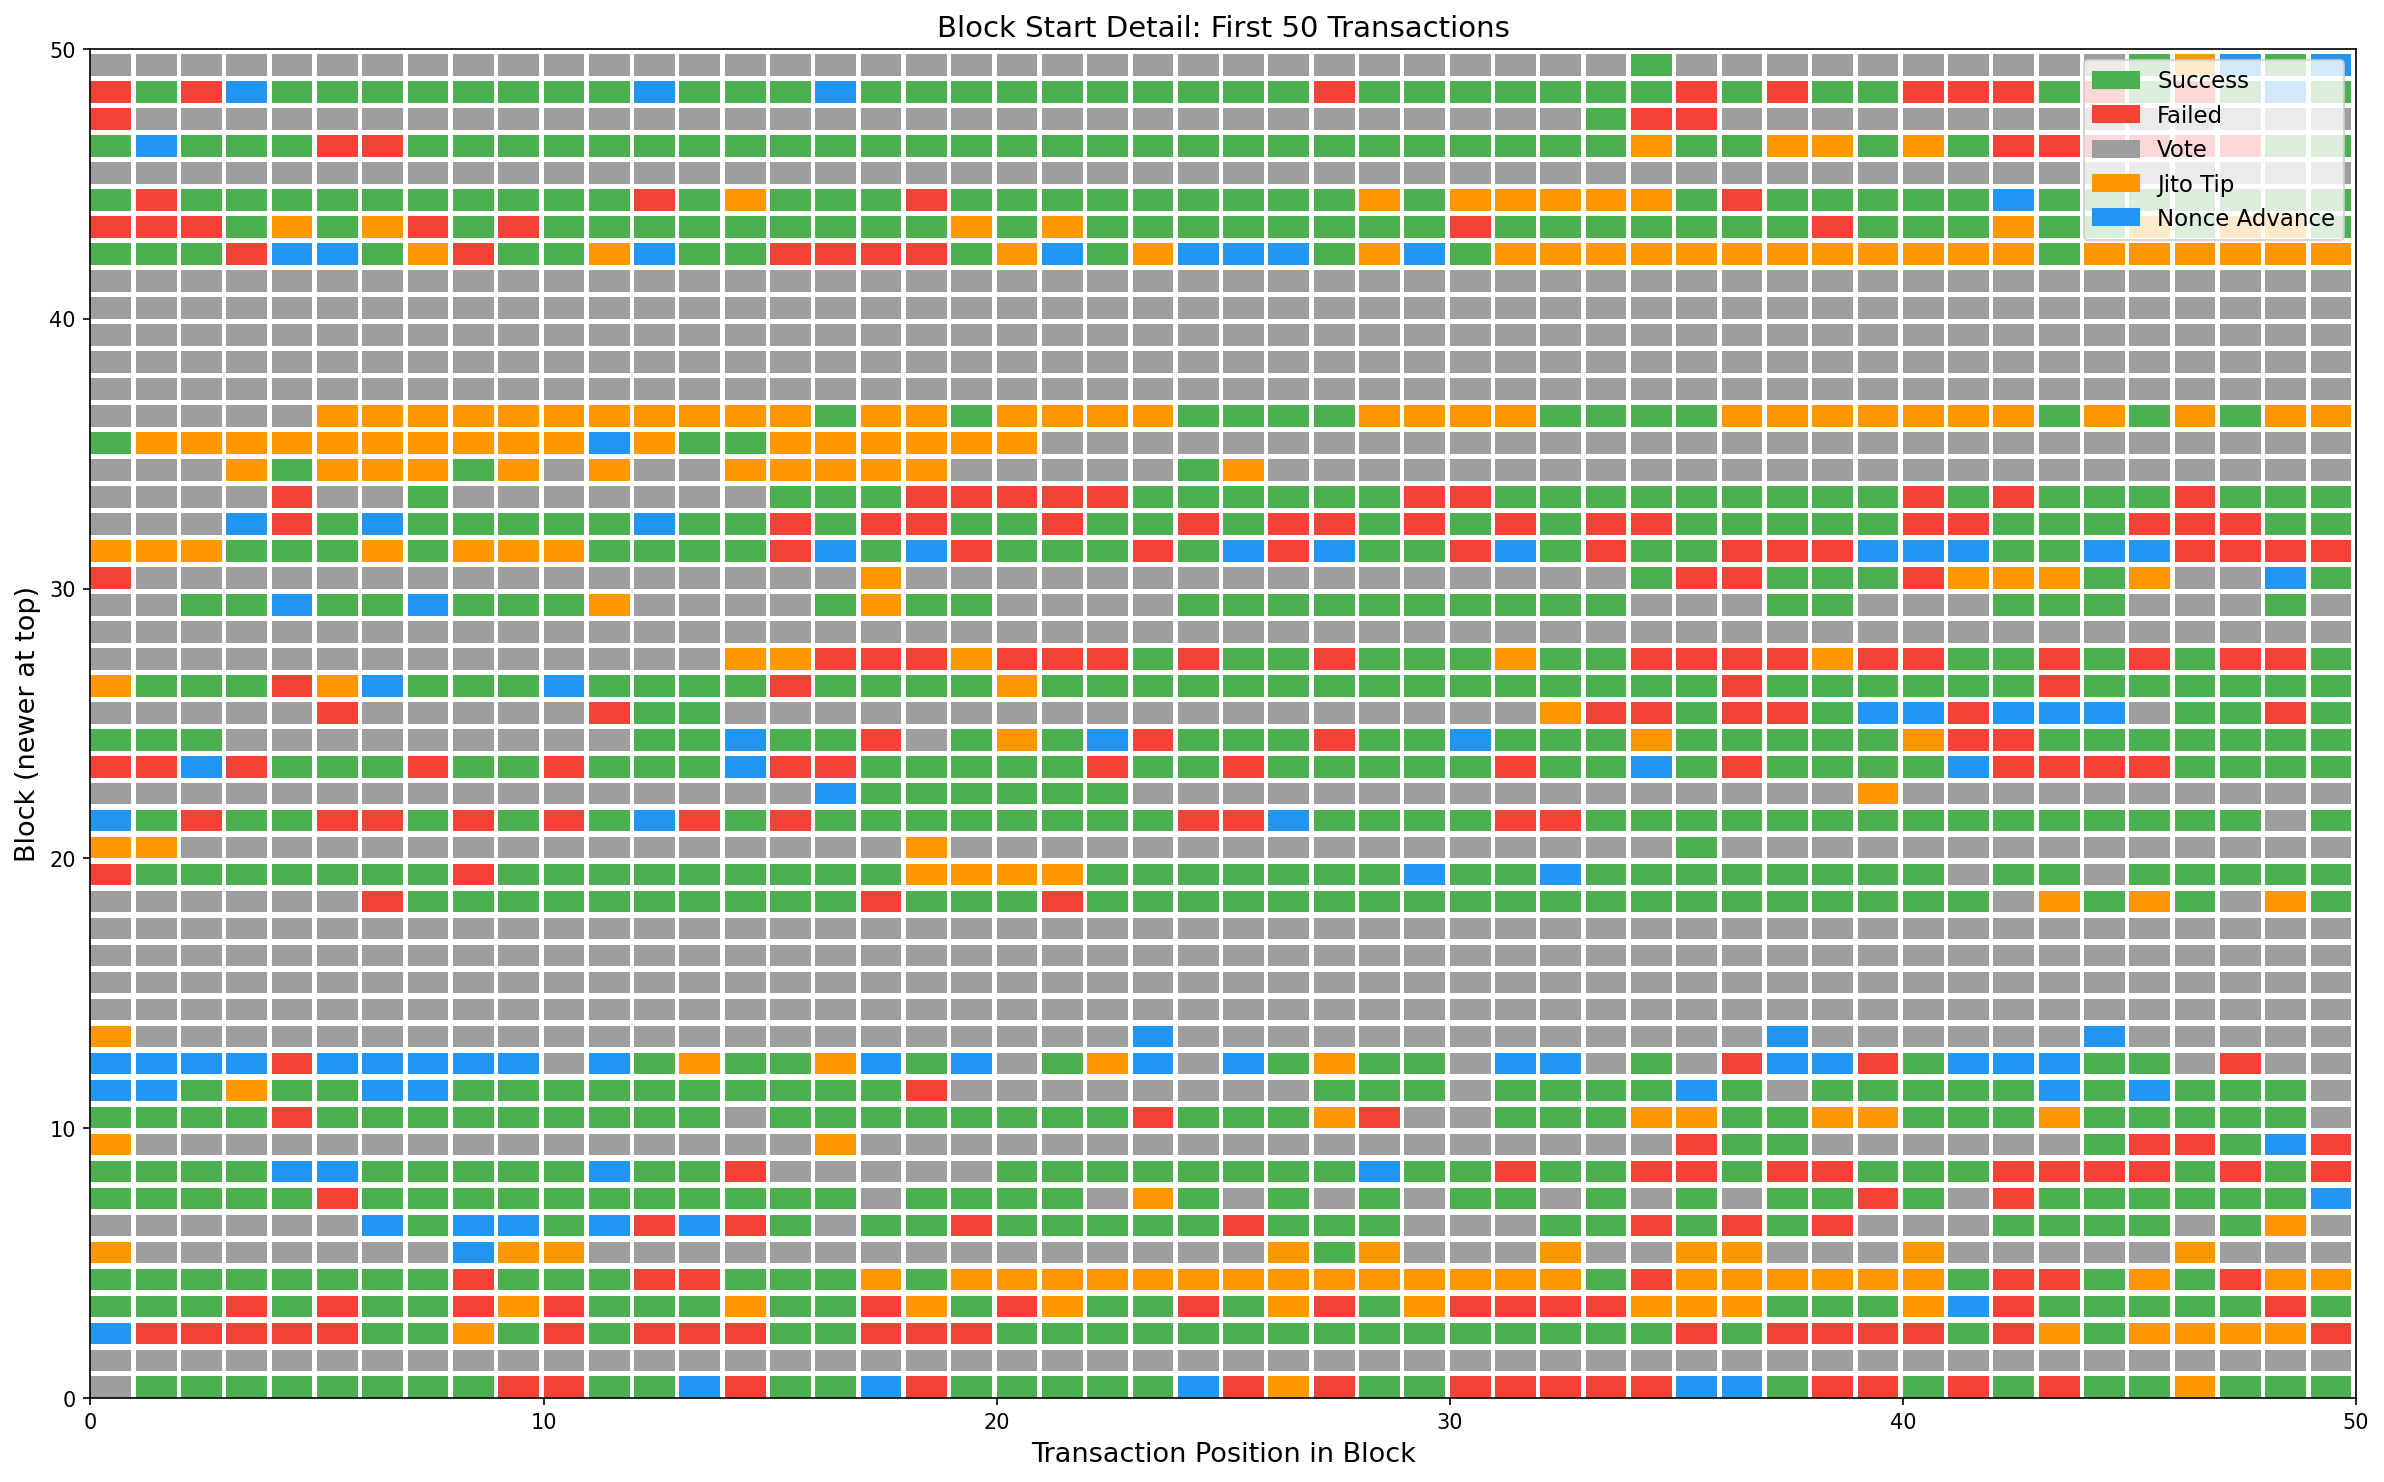
What jumps out:
- Jito tips (orange) appear throughout blocks but cluster in certain areas - these are MEV bundle tips
- Nonce transactions (blue) are scattered but more common toward the end of blocks
- Failed transactions (red) often cluster - multiple bots failing on the same opportunity
- Vote transactions (gray) tend to appear in bands - validators batch their votes
Methodology
For each block, we extracted:
- Leader: The validator who produced the block
- Transaction statuses: Success (S), Failure (F), or Vote (V) for each transaction, in order
- Jito tip positions: Transactions containing transfers to Jito tip addresses
- Nonce advance positions: Transactions with
advanceNonceas their first instruction (durable transactions)
We then calculated several metrics for each validator:
1. Position Analysis
For each transaction type, we computed the average normalized position within blocks (0 = front, 0.5 = middle, 1 = back). In a fair system, all types should average around 0.5.
2. Clustering Score
We measured how much transaction types are clustered together vs. randomly distributed. Using a sliding window of 50 transactions, we calculated the variance of type proportions. High variance = clustering.
3. Entropy Analysis
We computed the Shannon entropy of transaction ordering using bigram analysis. Higher entropy = more random/unpredictable ordering. Lower entropy = more structured/predictable patterns.
The Data
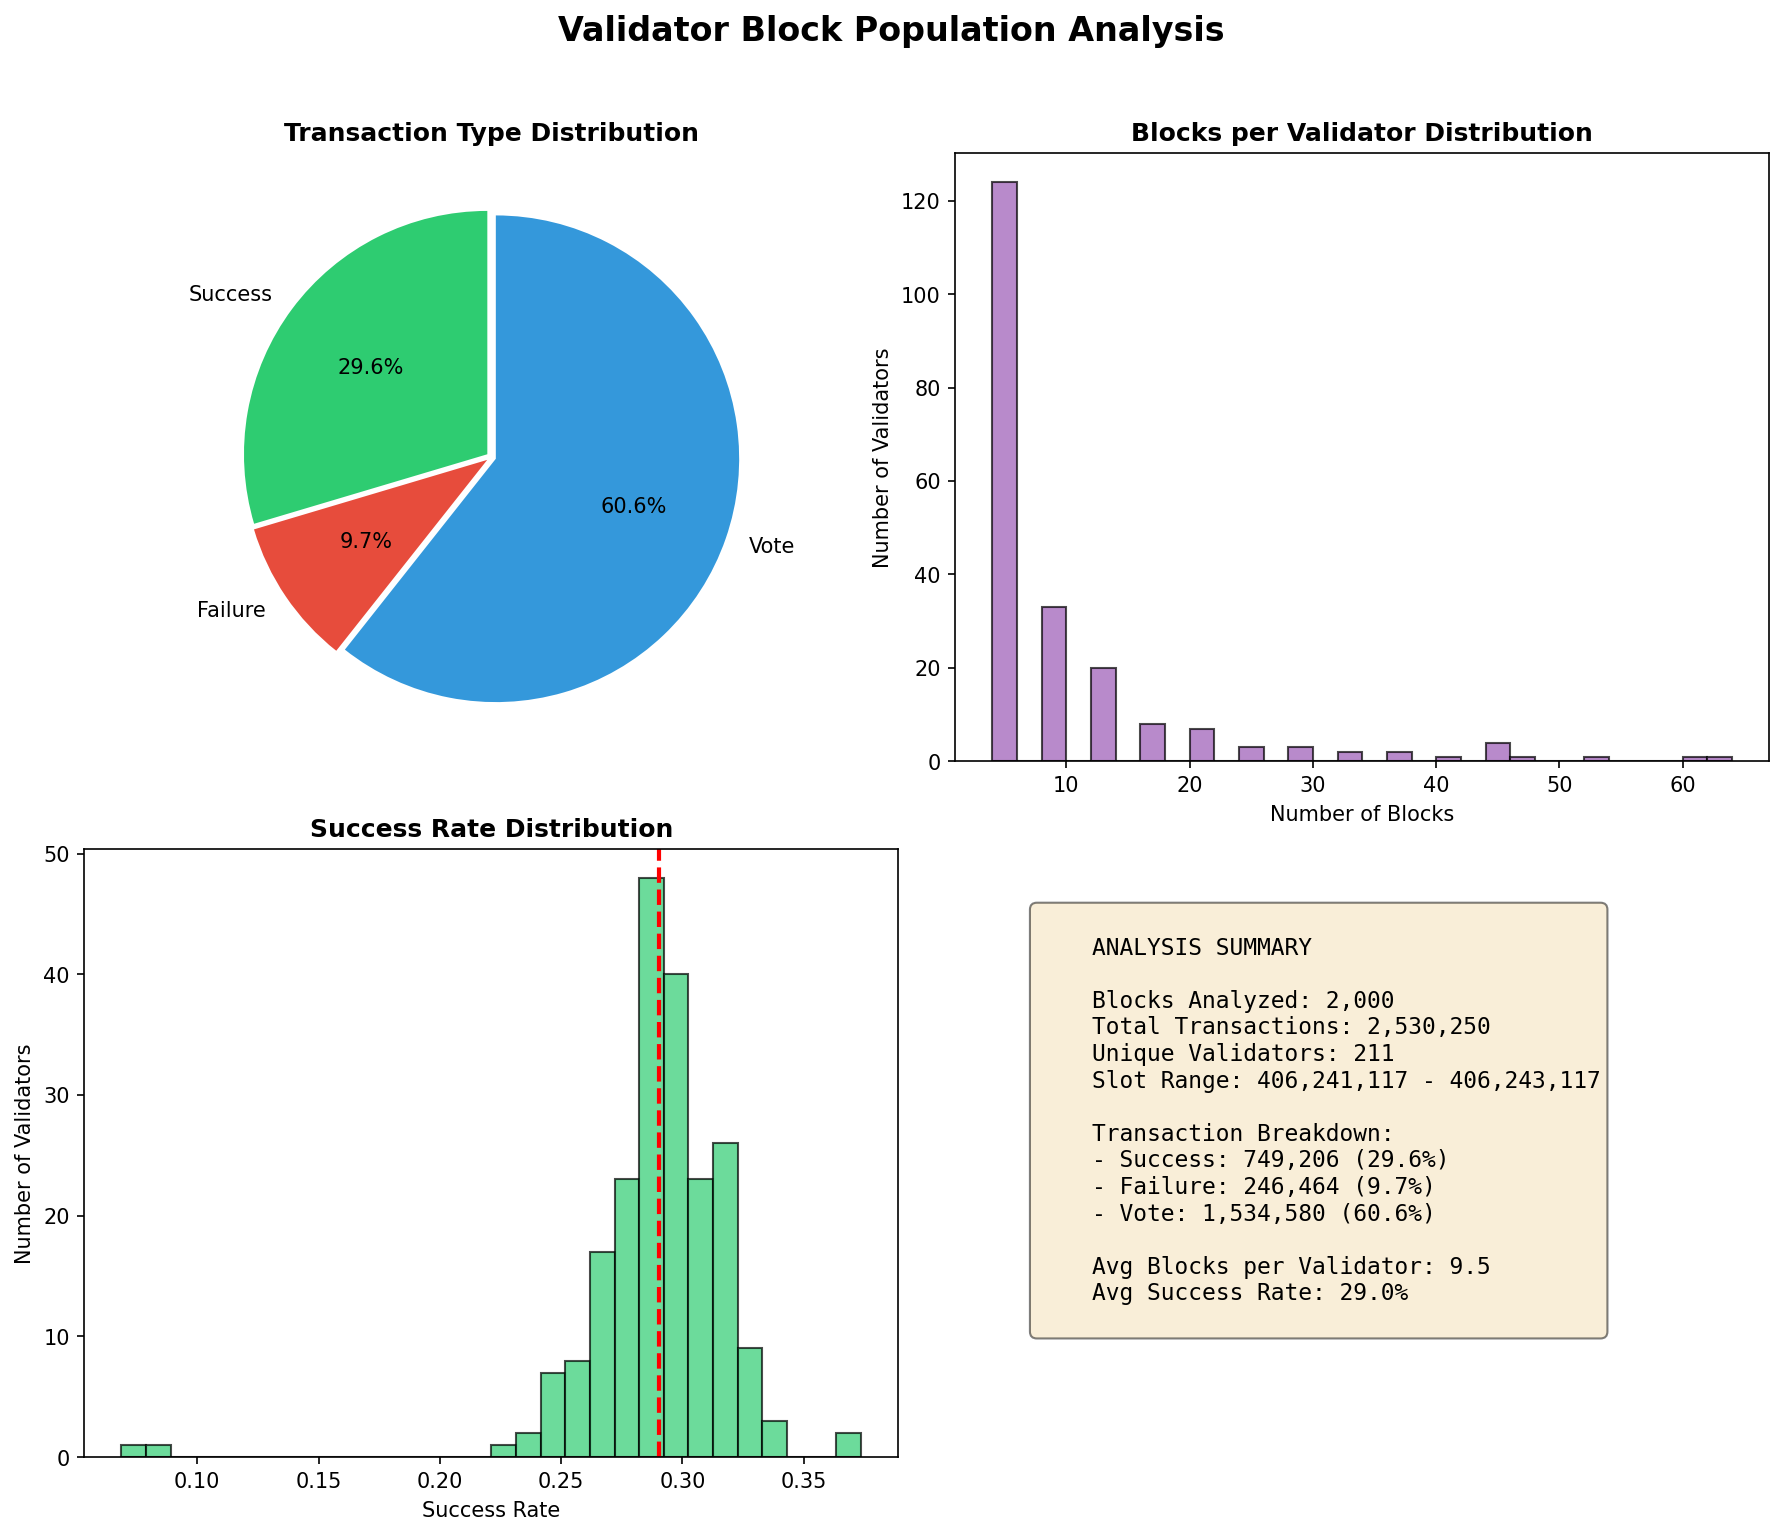
Our dataset covers:
- 26,991 blocks (approximately 3 hours of Solana network activity)
- 33,992,779 transactions (average 1,259 per block)
- 613 unique validators serving as block leaders
- 1,312,391 Jito tip transactions (3.86% of all transactions)
- 942,935 nonce advance transactions (2.77% of all transactions)
The transaction breakdown shows the typical Solana block composition: a mix of successful user transactions, failed transactions (often from MEV bots), validator vote transactions, and increasingly - MEV-related Jito bundles.
Finding 1: Transaction Types Are NOT Evenly Distributed
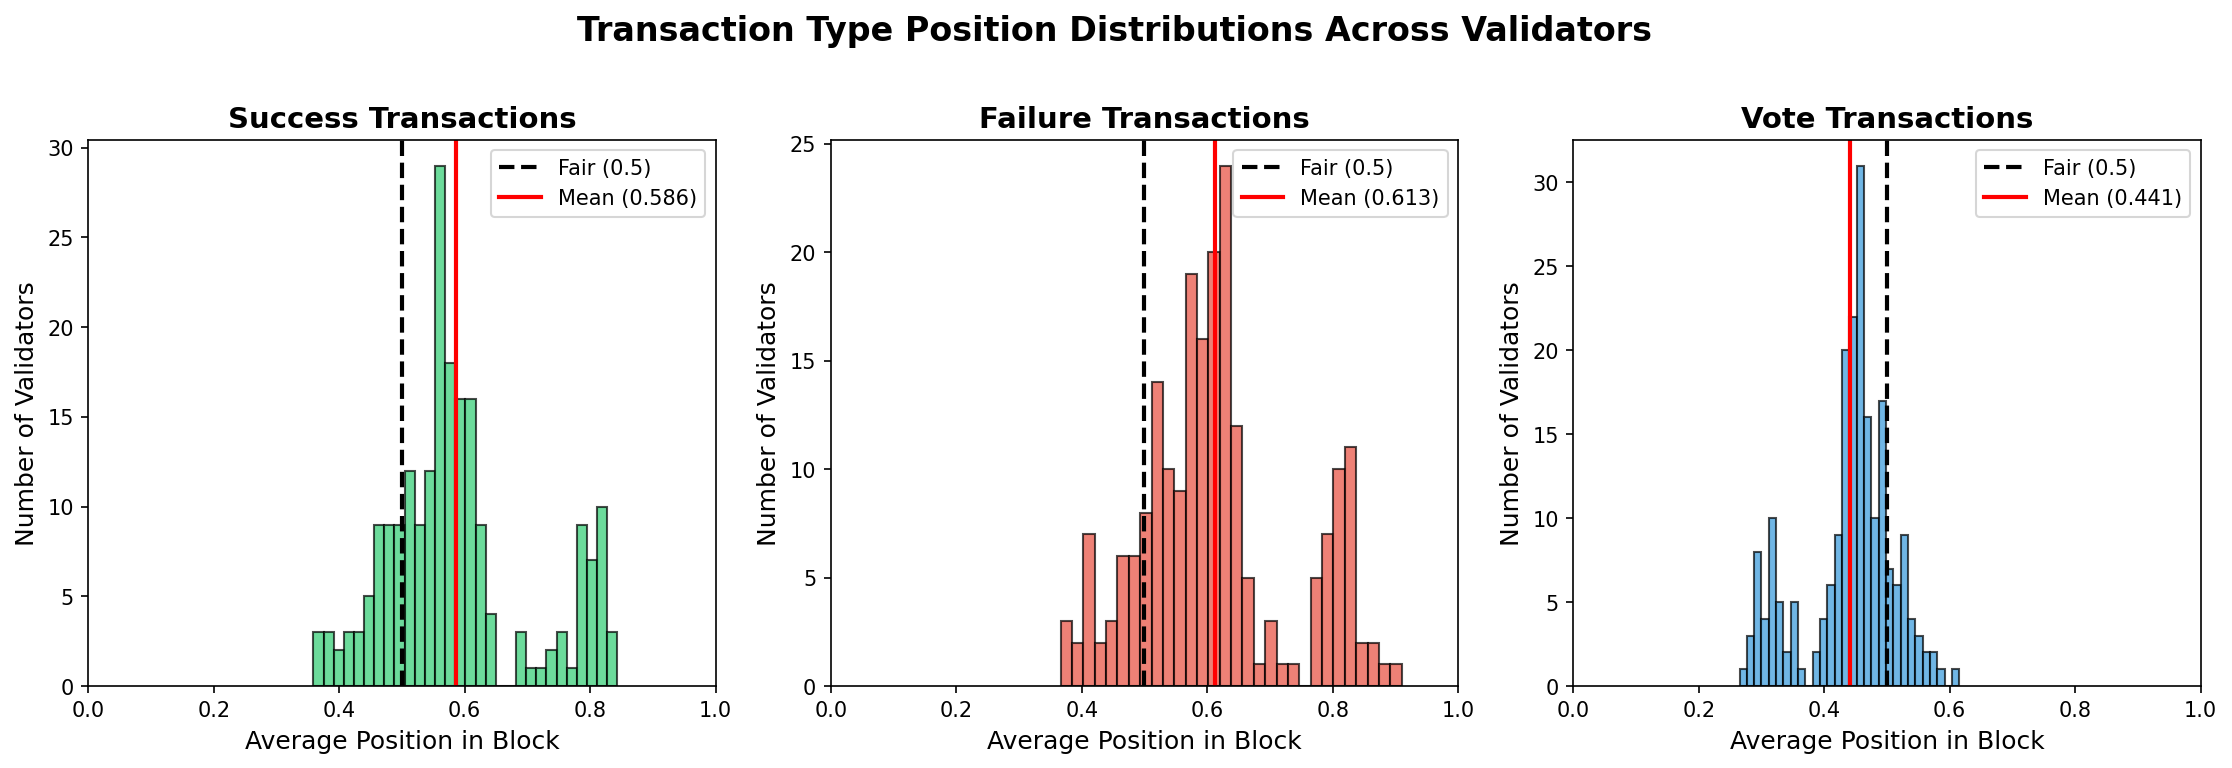
The first surprising finding: transaction positions are NOT uniformly distributed around 0.5.
| Transaction Type | Mean Position | Std Dev | Min | Max |
|---|---|---|---|---|
| Success | 0.586 | 0.113 | 0.359 | 0.843 |
| Failure | 0.613 | 0.119 | 0.366 | 0.910 |
| Vote | 0.441 | 0.071 | 0.265 | 0.615 |
Key observations:
- Vote transactions cluster toward the front (0.441 avg) - validators let votes pass through immediately while buffering user transactions for priority-fee sorting
- Success transactions are slightly back-loaded (0.586 avg) - counter to what we might expect if validators were front-running
- Failed transactions tend toward the back (0.613 avg) - these are often failed MEV attempts that arrive too late
If validators were purely ordering by arrival time (FIFO), we’d expect all three distributions to be nearly identical. The differences suggest either protocol-level effects or deliberate ordering strategies.
Finding 2: Five Distinct Validator Clusters Emerge
Using K-means clustering on position scores, entropy, and success rates, we identified 5 distinct behavioral clusters:
| Cluster | Validators | Success Pos | Failure Pos | Vote Pos | Entropy |
|---|---|---|---|---|---|
| 0 (Baseline) | 39 | 0.534 | 0.559 | 0.472 | 0.580 |
| 1 (Vote Front) | 21 | 0.780 | 0.800 | 0.315 | 0.509 |
| 2 (High Entropy) | 10 | 0.548 | 0.572 | 0.471 | 0.614 |
| 3 (Low Entropy) | 11 | 0.546 | 0.574 | 0.472 | 0.503 |
| 4 (Very High Entropy) | 7 | 0.591 | 0.613 | 0.439 | 0.716 |
Cluster 1 is most interesting: These 21 validators place votes at the very front (0.315) and push user transactions (success/failure) to the back (0.78-0.80). This likely indicates a buffer-and-sort strategy: validators let vote transactions pass through immediately while accumulating user transactions in a buffer, giving them a larger pool to sort by priority fee before placing them later in the block.
Finding 3: Entropy vs Position Reveals Suspicious Patterns
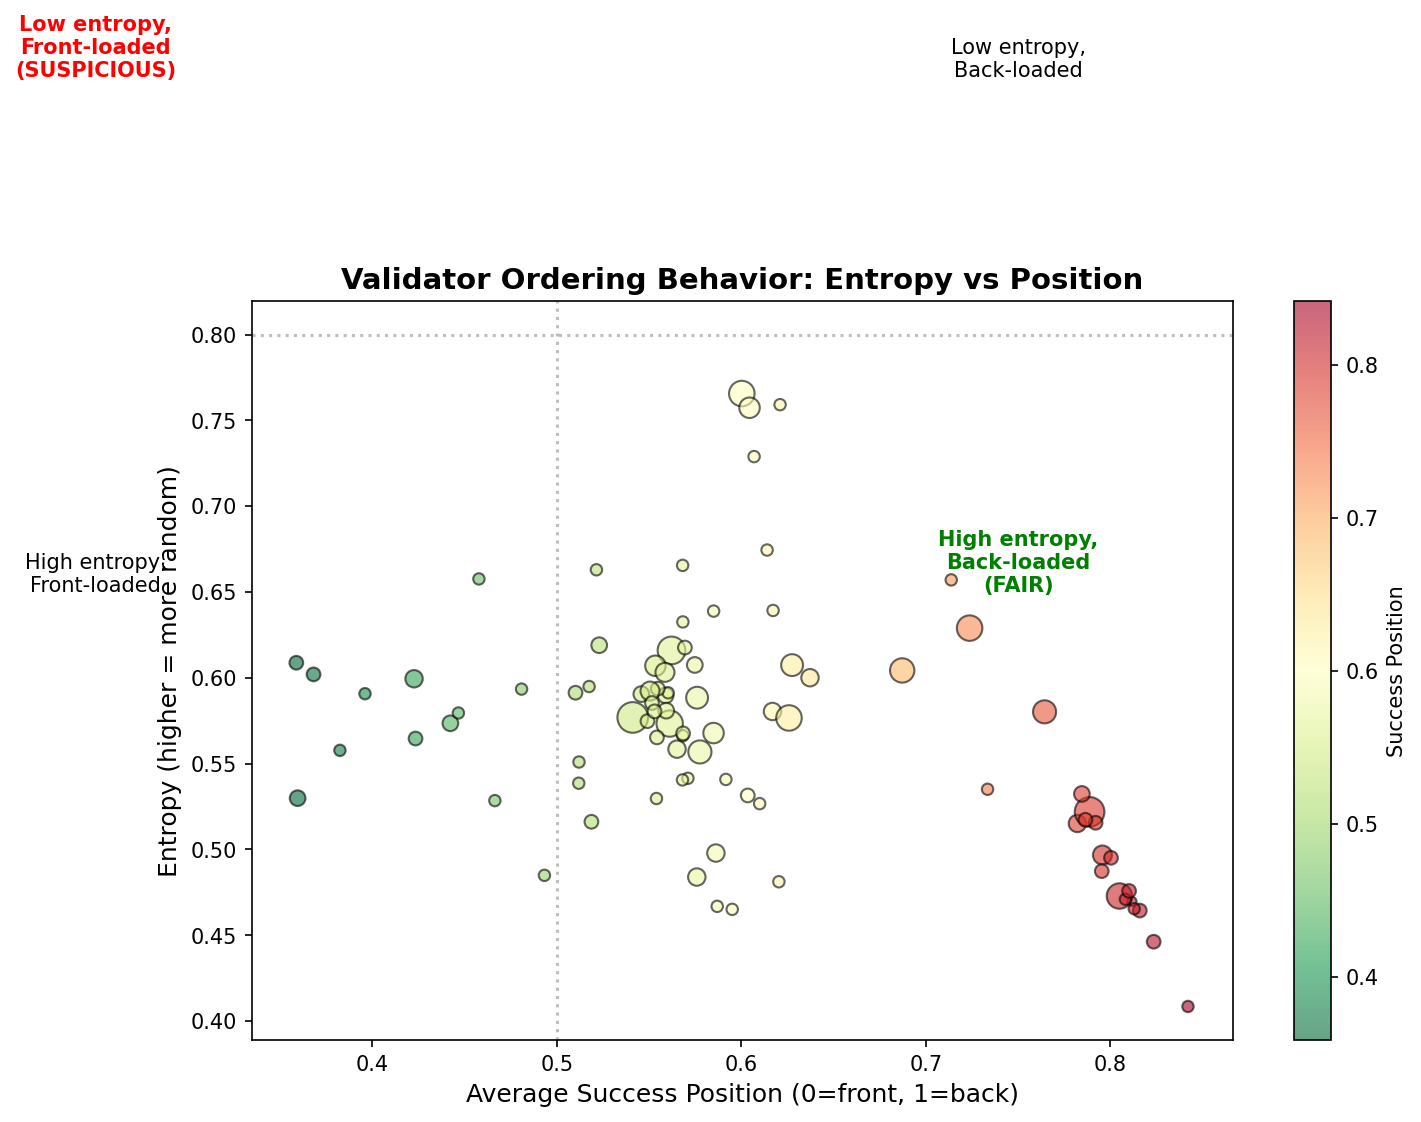
When we plot entropy (y-axis, randomness of ordering) against success position (x-axis, where successful transactions appear), distinct patterns emerge.
The plot is divided into quadrants:
- Top-left (High entropy, Front-loaded): Random ordering but success tends front
- Top-right (High entropy, Back-loaded): FAIR - High randomness, no positional bias
- Bottom-left (Low entropy, Front-loaded): SUSPICIOUS - Success transactions consistently at front with low randomness
- Bottom-right (Low entropy, Back-loaded): Structured ordering, success at back
Most validators cluster in the fair region, but outliers exist in the suspicious quadrant.
Finding 4: Most Extreme Validators
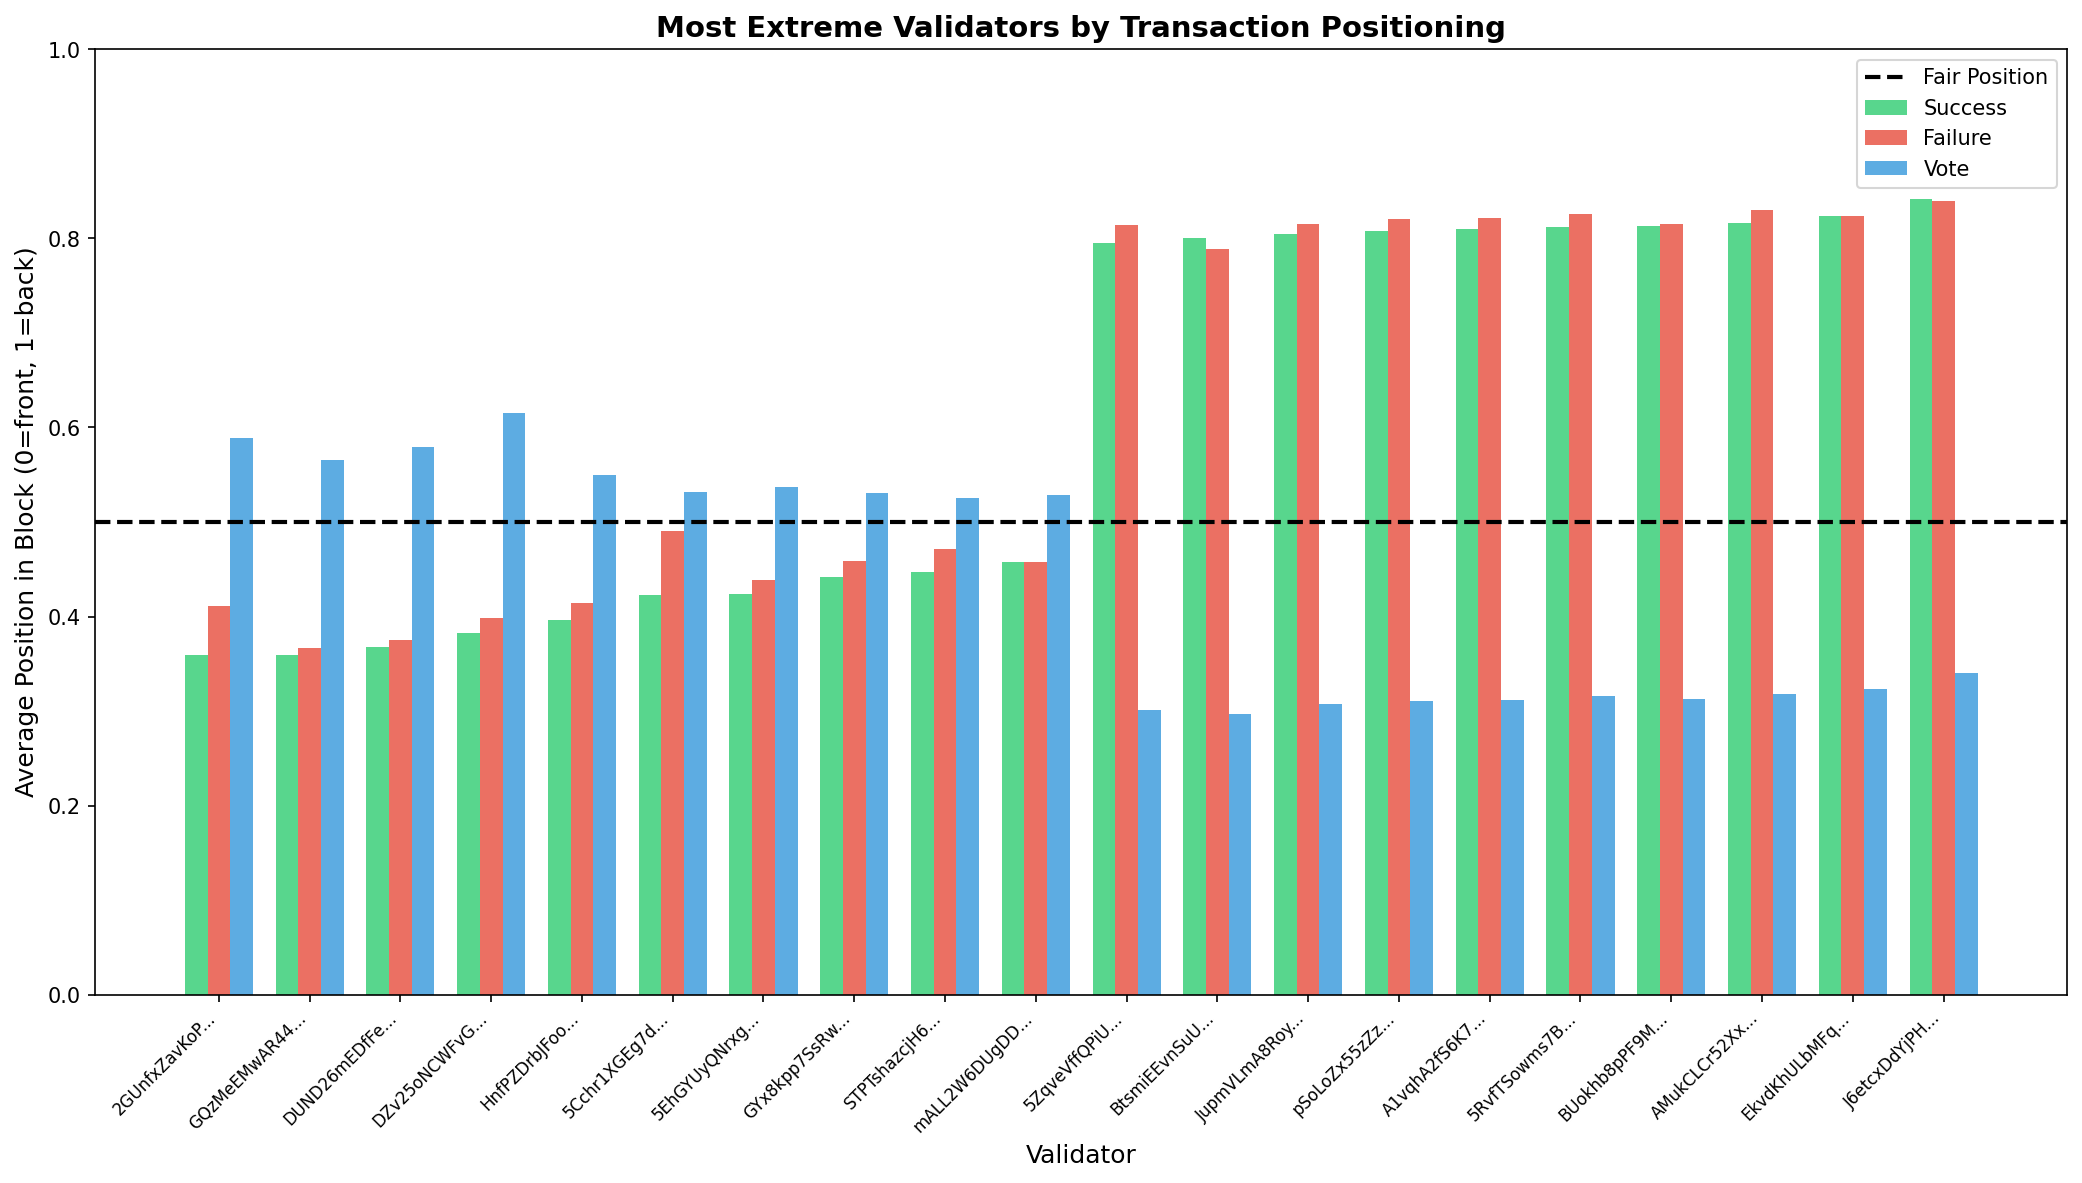
We identified validators with the most extreme ordering patterns:
Success Front-Loaded (9 validators detected)
| Validator | Success Position | Blocks | Concern Level |
|---|---|---|---|
| DUND26m… | 0.368 | 12 | High |
| HnfPZDr… | 0.396 | 8 | High |
| 5Cchr1X… | 0.423 | 20 | Medium |
These validators consistently place successful transactions at the front of blocks. With positions 0.1-0.15 below the mean (0.586), this represents a ~2 standard deviation outlier.
Failure Back-Loaded (70 validators detected)
| Validator | Failure Position | Blocks | Pattern |
|---|---|---|---|
| J6etcxD… | 0.840 | 8 | Extreme |
| AMukCLC… | 0.830 | 12 | Extreme |
| 5RvfTSo… | 0.826 | 5 | Extreme |
These validators push failed transactions to the very back. This could indicate sophisticated ordering - letting transactions compete and placing losers at the end.
Low Entropy (84 validators detected)
Validators with entropy below 0.7 show more predictable/structured ordering patterns. The most extreme (J6etcxD… at 0.409 entropy) shows very predictable transaction sequences.
Finding 5: Global Average Positions - The Big Picture
Before diving into distributions, here are the global average positions for each transaction type across all validators:
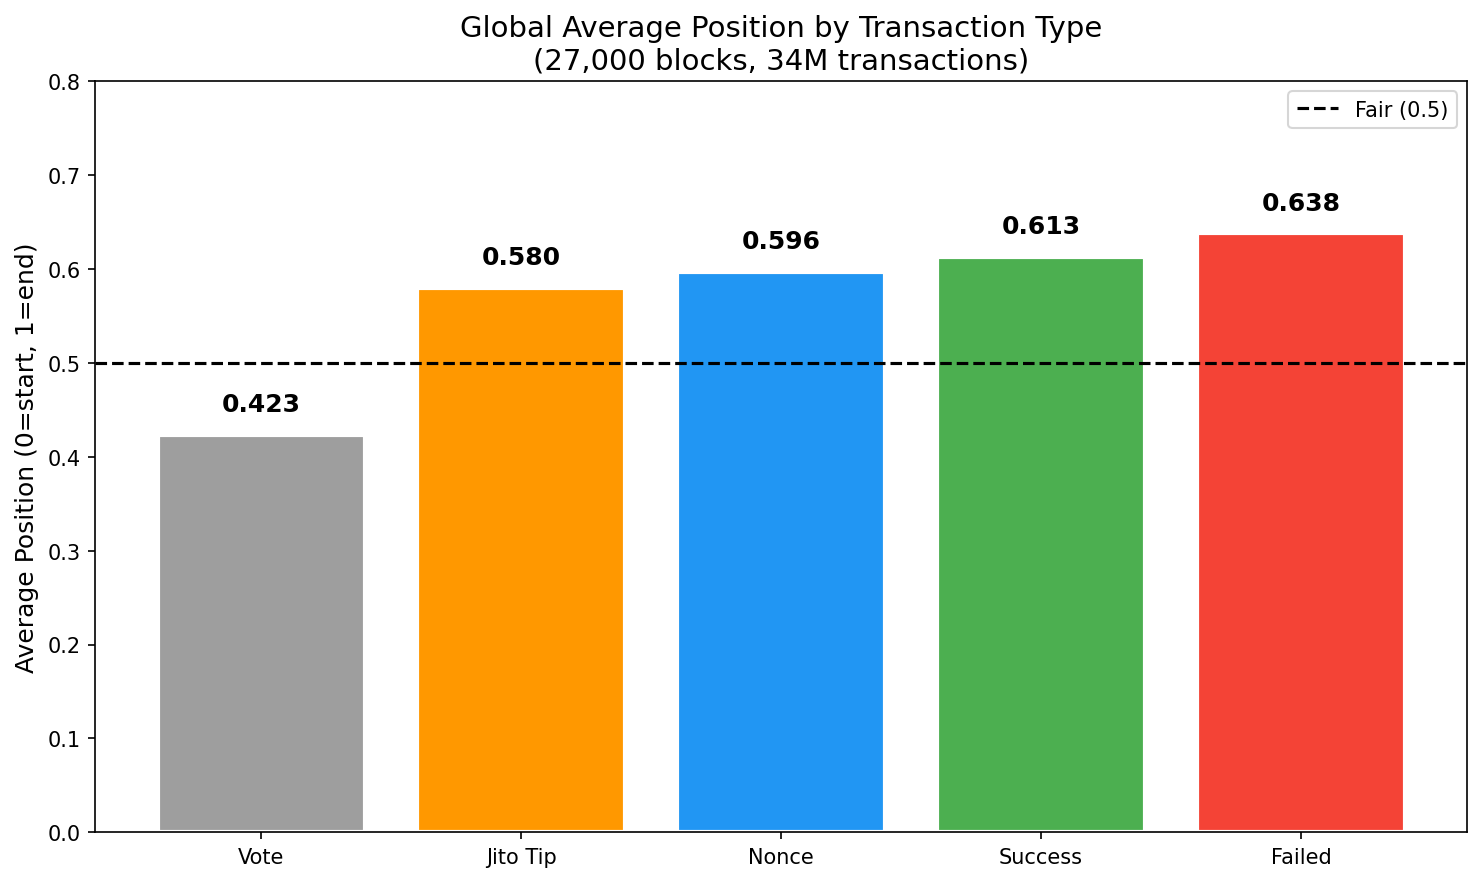
| Transaction Type | Average Position | Interpretation |
|---|---|---|
| Vote | 0.423 | Front-loaded (pass-through while buffering user txs) |
| Jito Tip | 0.580 | Slightly past middle |
| Nonce Advance | 0.596 | Slightly back-loaded |
| Success | 0.613 | Back-loaded |
| Failed | 0.638 | Most back-loaded (losers end up at the back) |
Key takeaway: Vote transactions cluster at the front (0.424), while failed transactions end up at the back (0.638). Jito tips and nonce advances sit near the middle, with Jito slightly more front-positioned than regular success transactions.
Finding 6: Validator Distribution - Position Strategies
Not all validators behave the same. Here’s how validators distribute by their average Jito and Nonce positioning:
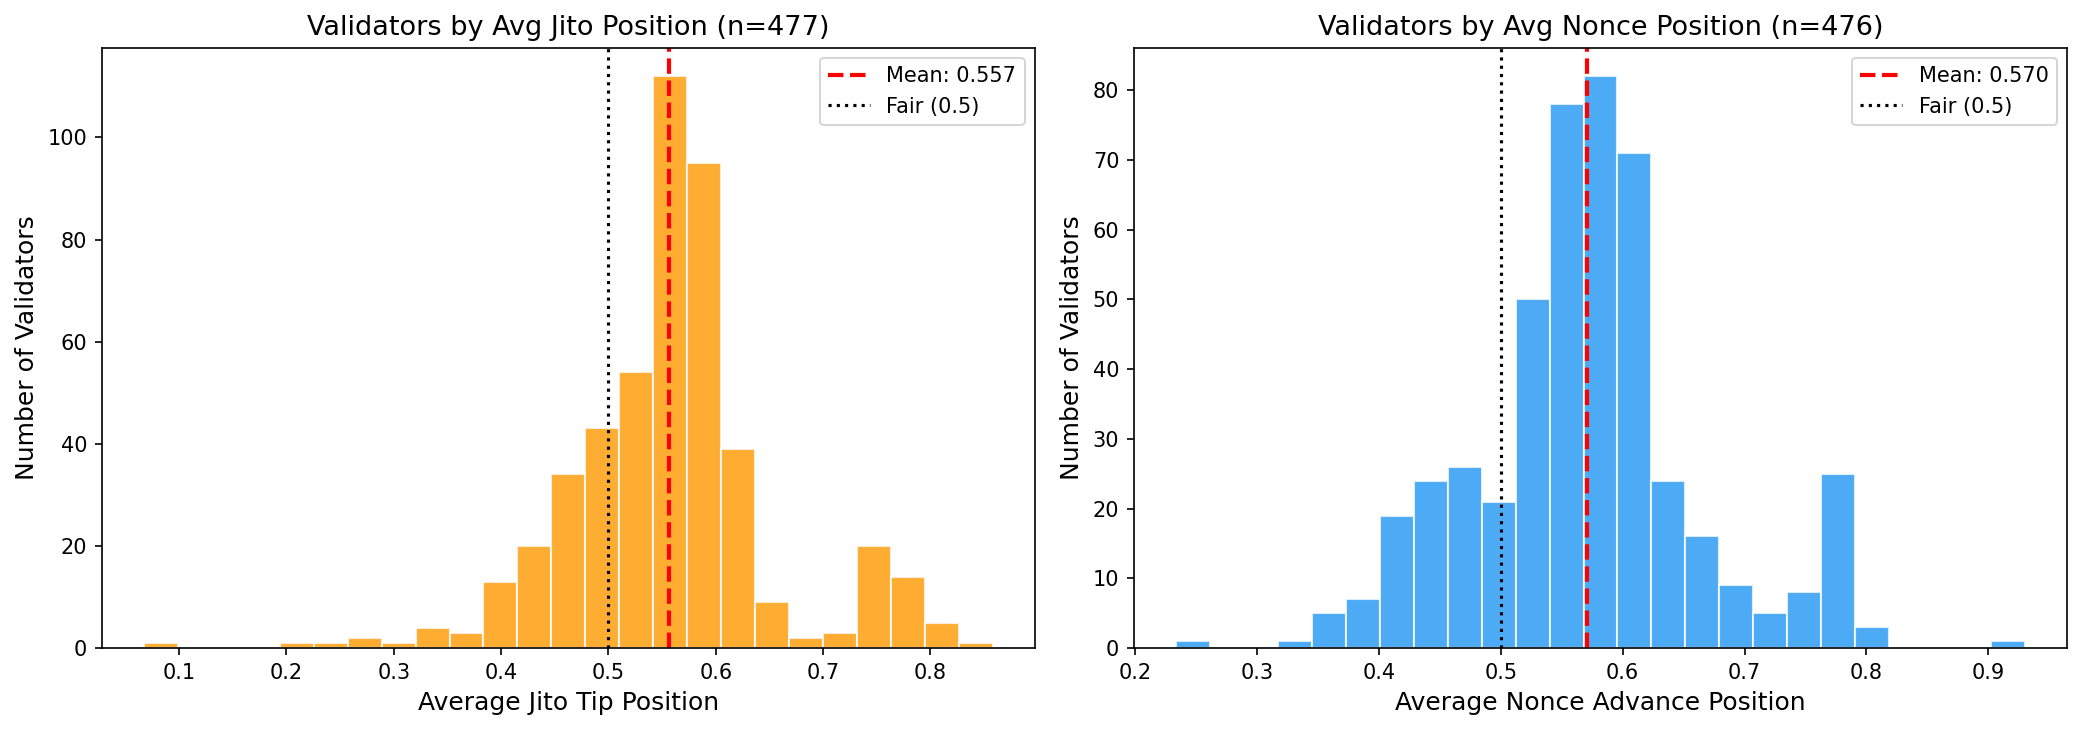
| Metric | Jito Tips | Nonce Advance |
|---|---|---|
| Mean position | 0.557 | 0.570 |
| Std deviation | 0.096 | 0.095 |
| Validators with pos < 0.4 | 19 | - |
| Validators with pos > 0.7 | 43 | - |
Observations:
- Most validators cluster around 0.5-0.6 for both Jito and Nonce positioning
- Some validators consistently place Jito tips early (< 0.4) - potentially prioritizing MEV bundles
- A longer tail toward higher positions (0.7+) suggests some validators deprioritize these tx types
Finding 7: Validator Distribution - Transaction Type Shares
How do blocks differ in their composition across validators?
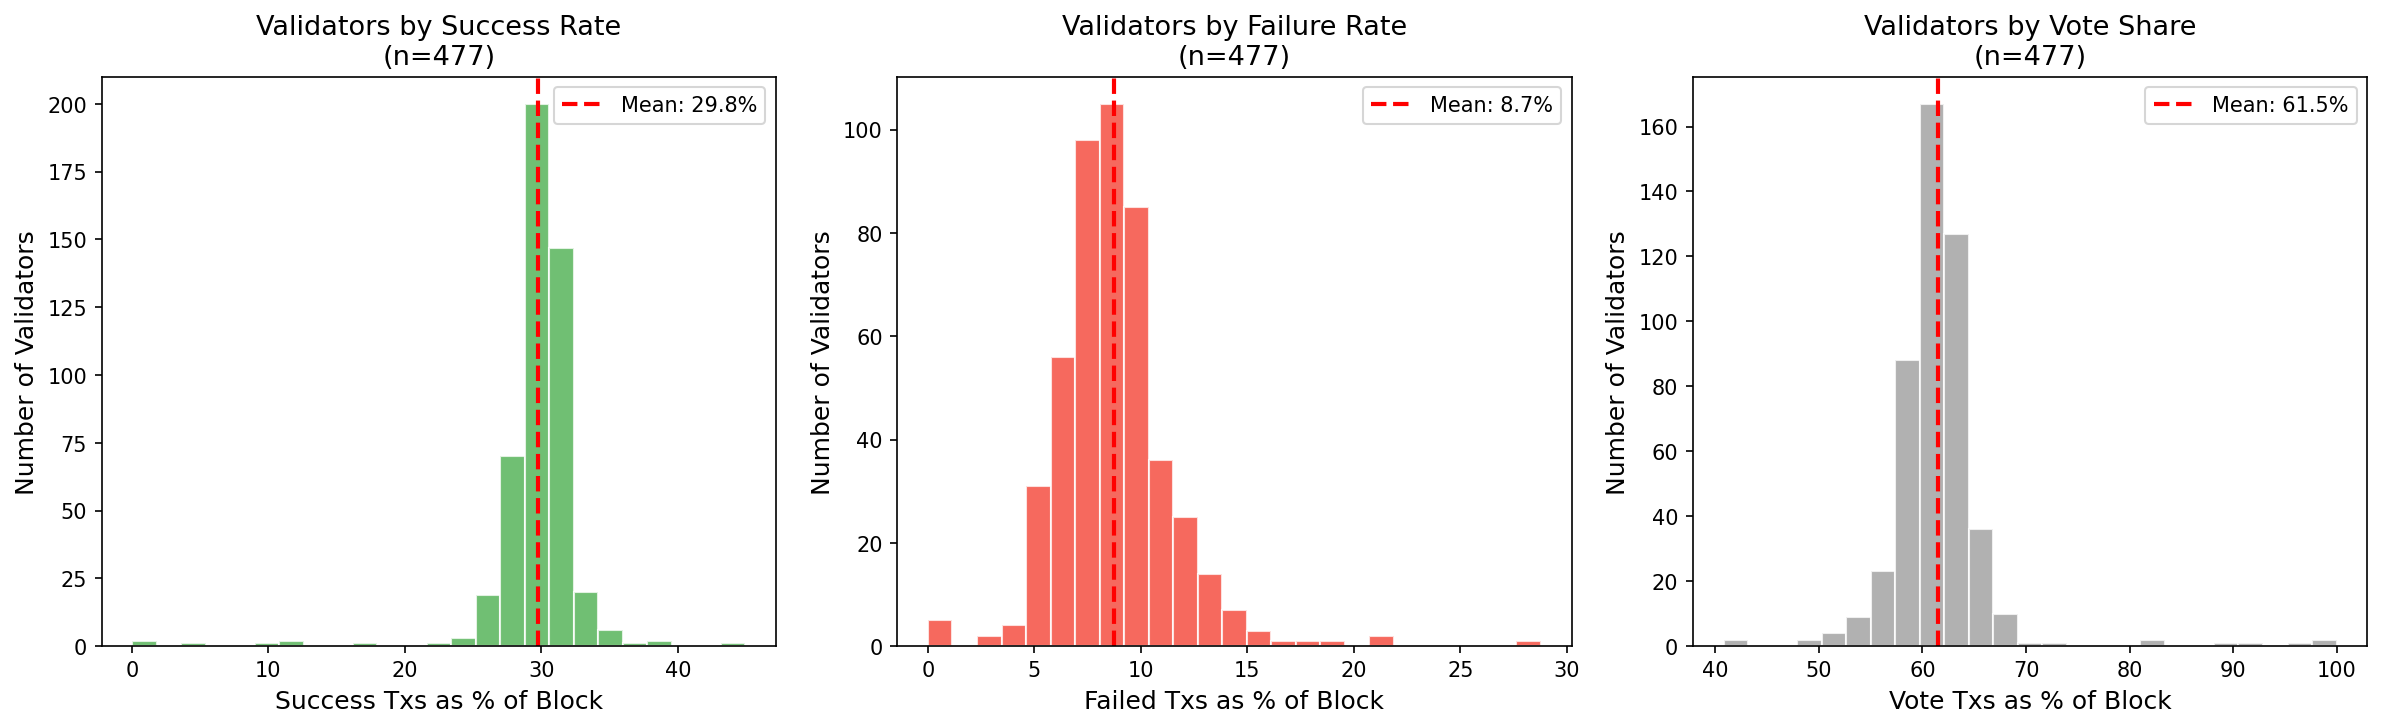
| Metric | Success | Failed | Vote |
|---|---|---|---|
| Mean | 29.8% | 8.7% | 61.5% |
| Std deviation | 3.4% | 2.7% | 4.9% |
| Outliers (high) | 1 (>40%) | 3 (>20%) | 9 (>70%) |
Observations:
- Vote transactions dominate blocks (~61%), as expected for consensus
- Success rate is fairly consistent across validators (29.8% ± 3.4%)
- Failed transaction rate varies more (8.7% ± 2.7%) - some validators see more MEV competition
- 3 validators have >20% failed transactions - likely targeted by competing bots
Finding 8: Validator Distribution - Jito & Nonce Shares
How much of each validator’s blocks are Jito tips vs nonce transactions?
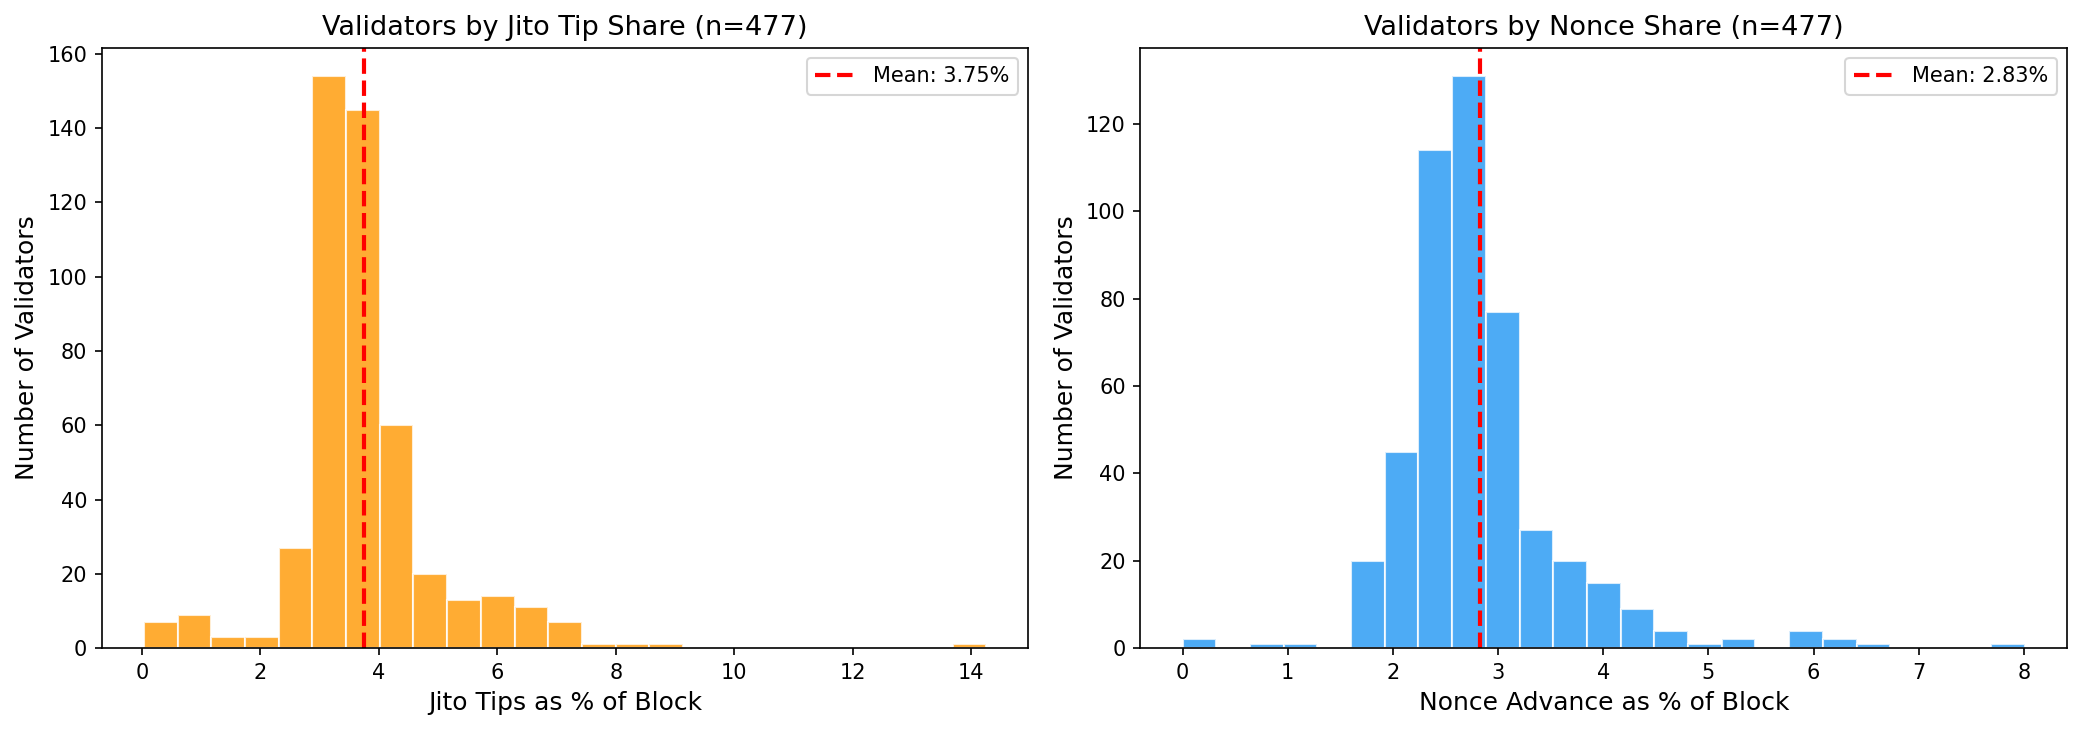
| Metric | Jito Tip Share | Nonce Share |
|---|---|---|
| Mean | 3.75% | 2.83% |
| Std deviation | 1.26% | 0.77% |
| Validators > 5% | 53 | 10 |
Observations:
- Jito share varies significantly (1.26% std) - some validators attract more MEV bundles
- Nonce share is more consistent across validators (0.77% std)
- 53 validators have >5% Jito tips - these may be preferred by MEV searchers
Finding 10: Block Heatmap - Visualizing Transaction Flow
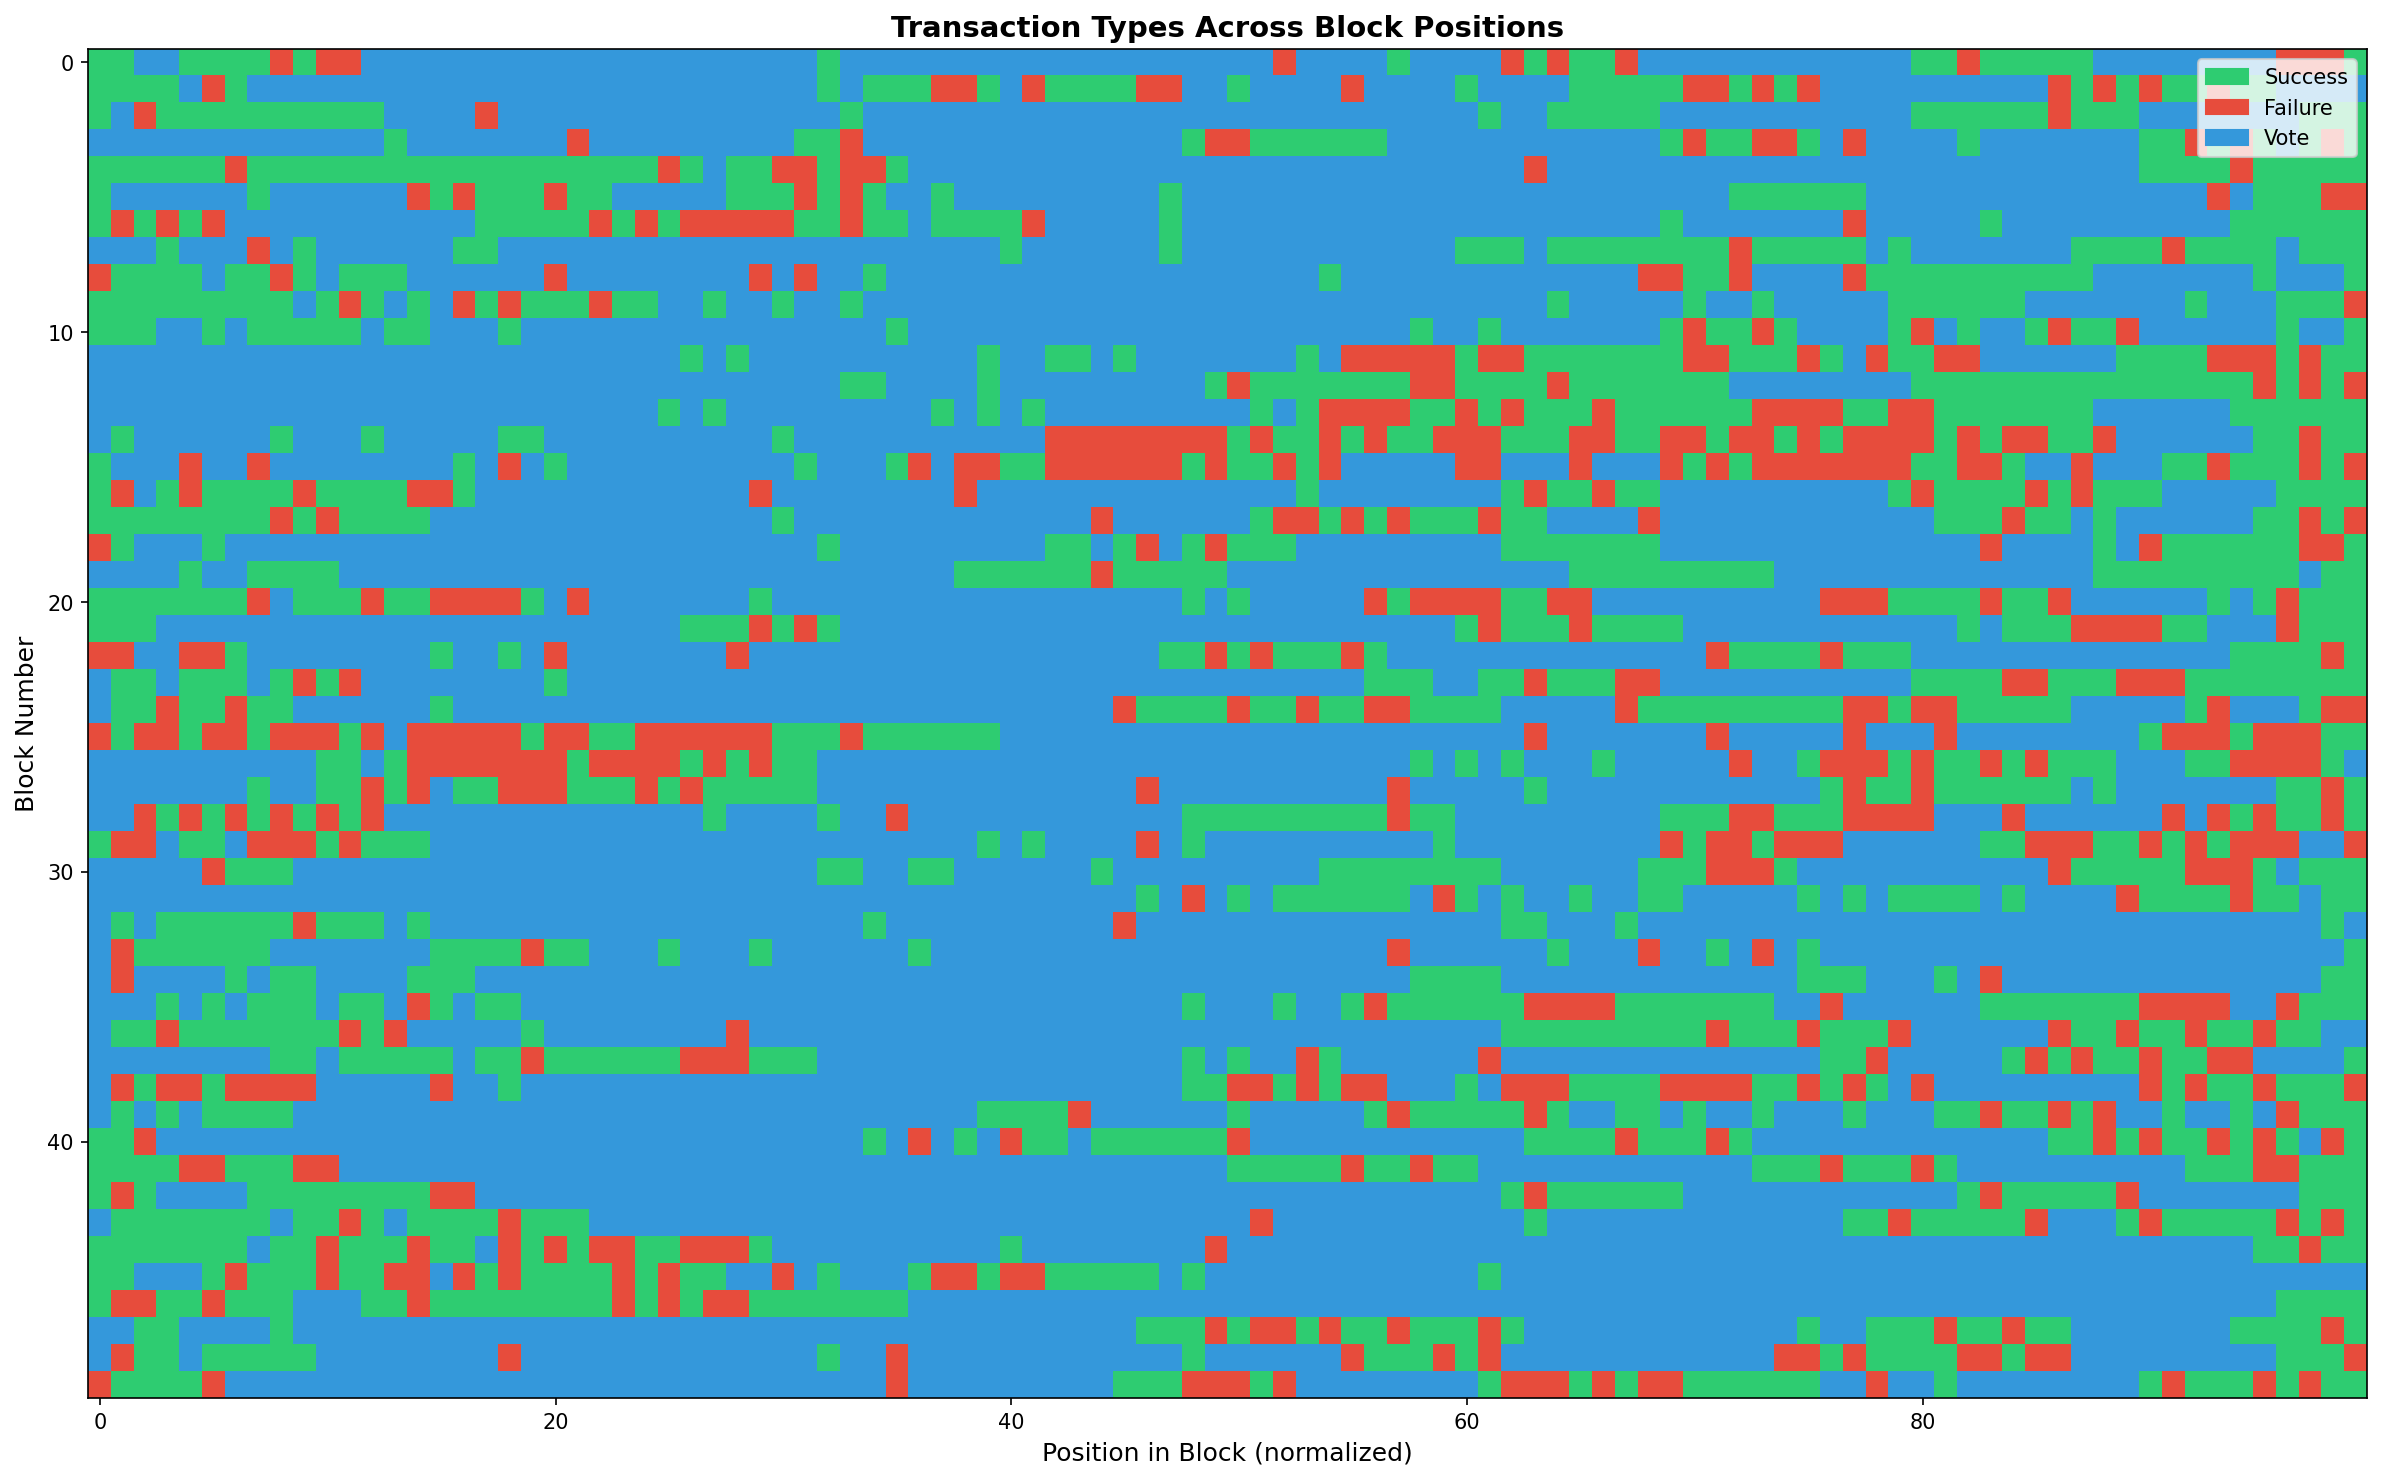
This heatmap shows transaction types across block positions for a sample of 50 blocks:
- Green: Success transactions
- Red: Failure transactions
- Blue: Vote transactions
You can see clear patterns emerge:
- Vote transactions (blue) often appear in clusters at the beginning or middle
- Success and failure transactions are more randomly distributed
- Some blocks show distinct “bands” of transaction types
Finding 11: Cluster Analysis (PCA)
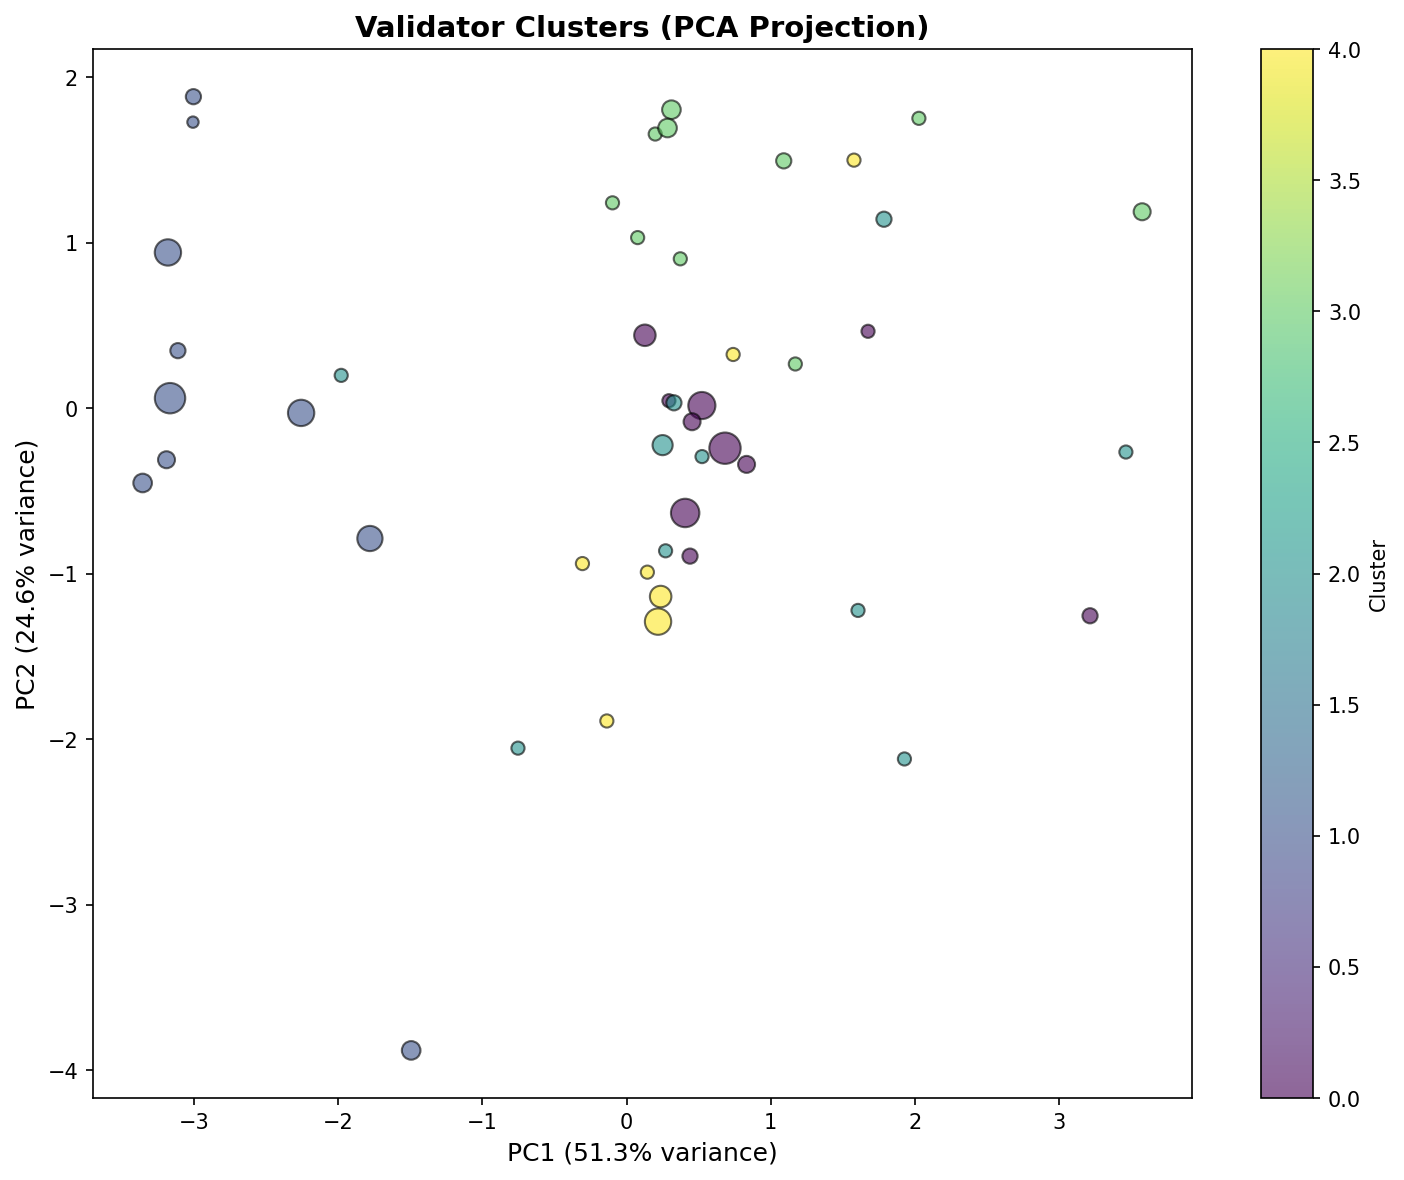
Using Principal Component Analysis to reduce dimensionality, we can visualize how validators group by behavior. The distinct clusters confirm that validators don’t all behave the same way - there are measurably different strategies in block population.
What Does This Mean?
For Users
Most validators appear to order transactions fairly, but the existence of outliers suggests that:
- Some validators may be engaging in preferential ordering
- Transaction timing relative to validator selection matters
- Using Jito or similar MEV protection may be worthwhile for large transactions
For Researchers
This analysis scratches the surface. Future work could:
- Correlate validator behavior with profitability (do front-loading validators earn more?)
- Identify specific MEV extraction patterns in transaction sequences
- Track changes in validator behavior over time
- Analyze at the account level (are certain accounts favored?)
For Validators
The data shows that fair ordering is the norm. Validators deviating significantly from the mean may face reputation consequences as this type of analysis becomes more common.
Technical Details
Our analysis used:
- Helius RPC for block data retrieval
- Position normalization to compare blocks of different sizes (normalized to 0-1)
- Running window analysis (window size: 50 transactions) for clustering detection
- Bigram entropy for ordering randomness measurement
- K-means clustering (k=5) to identify validator behavior groups
Data Collection Notes
- Fetched 26,991 consecutive blocks (~3 hours of network activity)
- Each block averaged 1,259 transactions
- 613 unique validators served as leaders during this period
- Tracked Jito tip transactions via transfers to known Jito tip addresses
- Tracked nonce advance transactions via
advanceNoncefirst instruction detection - All raw data stored in compressed JSON format for reproducibility
Conclusion
The good news: Most Solana validators appear to order transactions fairly. The mean success position (0.586) is only slightly back-loaded, and entropy scores generally indicate reasonable randomness.
The nuanced news: Clear behavioral clusters exist. Some validators (Cluster 1) use a buffer-and-sort strategy, letting votes pass while accumulating user transactions for priority sorting. Others show notably low entropy. 9 validators show statistically significant success front-loading.
The open question: Is the variation we observe due to:
- Technical differences in validator client implementations?
- Network latency and transaction arrival patterns?
- Intentional ordering for MEV extraction?
Further analysis with larger datasets and correlation to profits would help distinguish these possibilities.
As Solana’s validator set evolves and MEV infrastructure matures, monitoring validator ordering behavior will become increasingly important for maintaining network health and user trust.
Data and analysis scripts available in our research repository. Have questions about this analysis? Found a bug in our methodology? Reach out to us on Twitter/X or join our Discord.