When a token launches on pumpfun, the contention happens in well under a second. Block explorers can’t show this — they stop at slot granularity (~400 ms) and slot timestamps are usually second-precision. This post zooms in on what a single Solana validator actually saw during two real pumpfun launches that landed in its blocks.
We use one validator — EvnRmnMrd69kFdbLMxWkTn1icZ7DCceRhvmb2SJXqDo4 — and look only at swap activity that occurred in its own post-launch slots. Solana validators get up to 4 consecutive slots per leader rotation, so when a token launches in the first slot of such a rotation, this validator effectively owns the whole launch window.
How to read the charts
Every bar is one swap attempt against the new token’s pumpfun bonding curve, observed in a slot produced by this validator. The visual encoding is:
| Channel | What it shows |
|---|---|
| Bar color | 🔵 blue = the token-creation (launch) transaction · 🟢 green = swap succeeded · 🔴 red = swap failed on-chain |
| Bar height | total fee paid in SOL (base fee + priority fee), on a log scale. The blue launch bar uses a placeholder height equal to the max swap fee — it marks when the launch happened, not how much it cost. |
| Bar x-position | wall-clock entry time from the tx_timestamps table (microsecond-precision unix time, plotted in milliseconds relative to the first observed tx) |
| Distance between bars | the actual real-time gap between two transactions reaching the leader |
| Dotted vertical lines | slot boundaries (slot N, slot N+1, …) within the validator’s leader run |
Both buys and sells are included — direction is shown in tooltips on the interactive viewer, not in the static images.
The x-axis is real time, not transaction index — tight bursts look tight, idle stretches stay blank. That’s the whole point: most pumpfun-launch visualizations smear this away.
The fee shown is the realized lamports the signer was charged, regardless of outcome. Failed transactions still pay their priority fee, and that’s the most informative signal for “who was willing to burn SOL to be first.”
Methodology — restricting to one validator’s slots
We do not count swaps that happened in other validators’ slots. The procedure is:
- List every slot produced by
EvnRm…XqDo4in the last 72 h (11,349 blocks). - Group those slots into leader runs — maximal contiguous sequences of slots (Solana gives each leader up to 4 in a row).
- Find every pumpfun token whose creation transaction landed in one of those slots.
- For each launch in slot
Swith run-endR, count swaps in slotsS, S+1, …, R(all owned by this validator). - Rank by trade count, take the top two.
The two winners both landed in the first slot of a 4-slot leader run, so the validator produced the entire post-launch window.
Launch #1 — Muttley Crew (UNDERDOGS)
- Validator’s window: slots 424,667,236 → 424,667,239 (4 slots)
- 37 swap attempts inside the window: 25 succeeded / 12 failed (32% fail rate); 34 buys / 3 sells
- Wall-clock span: 1,290.9 ms
- Total fees paid: 0.318 SOL, of which 0.198 SOL (62%) was burned by failed attempts
- Median gap between consecutive transactions: 1.9 ms (some sub-100 μs spacings within burst clusters)
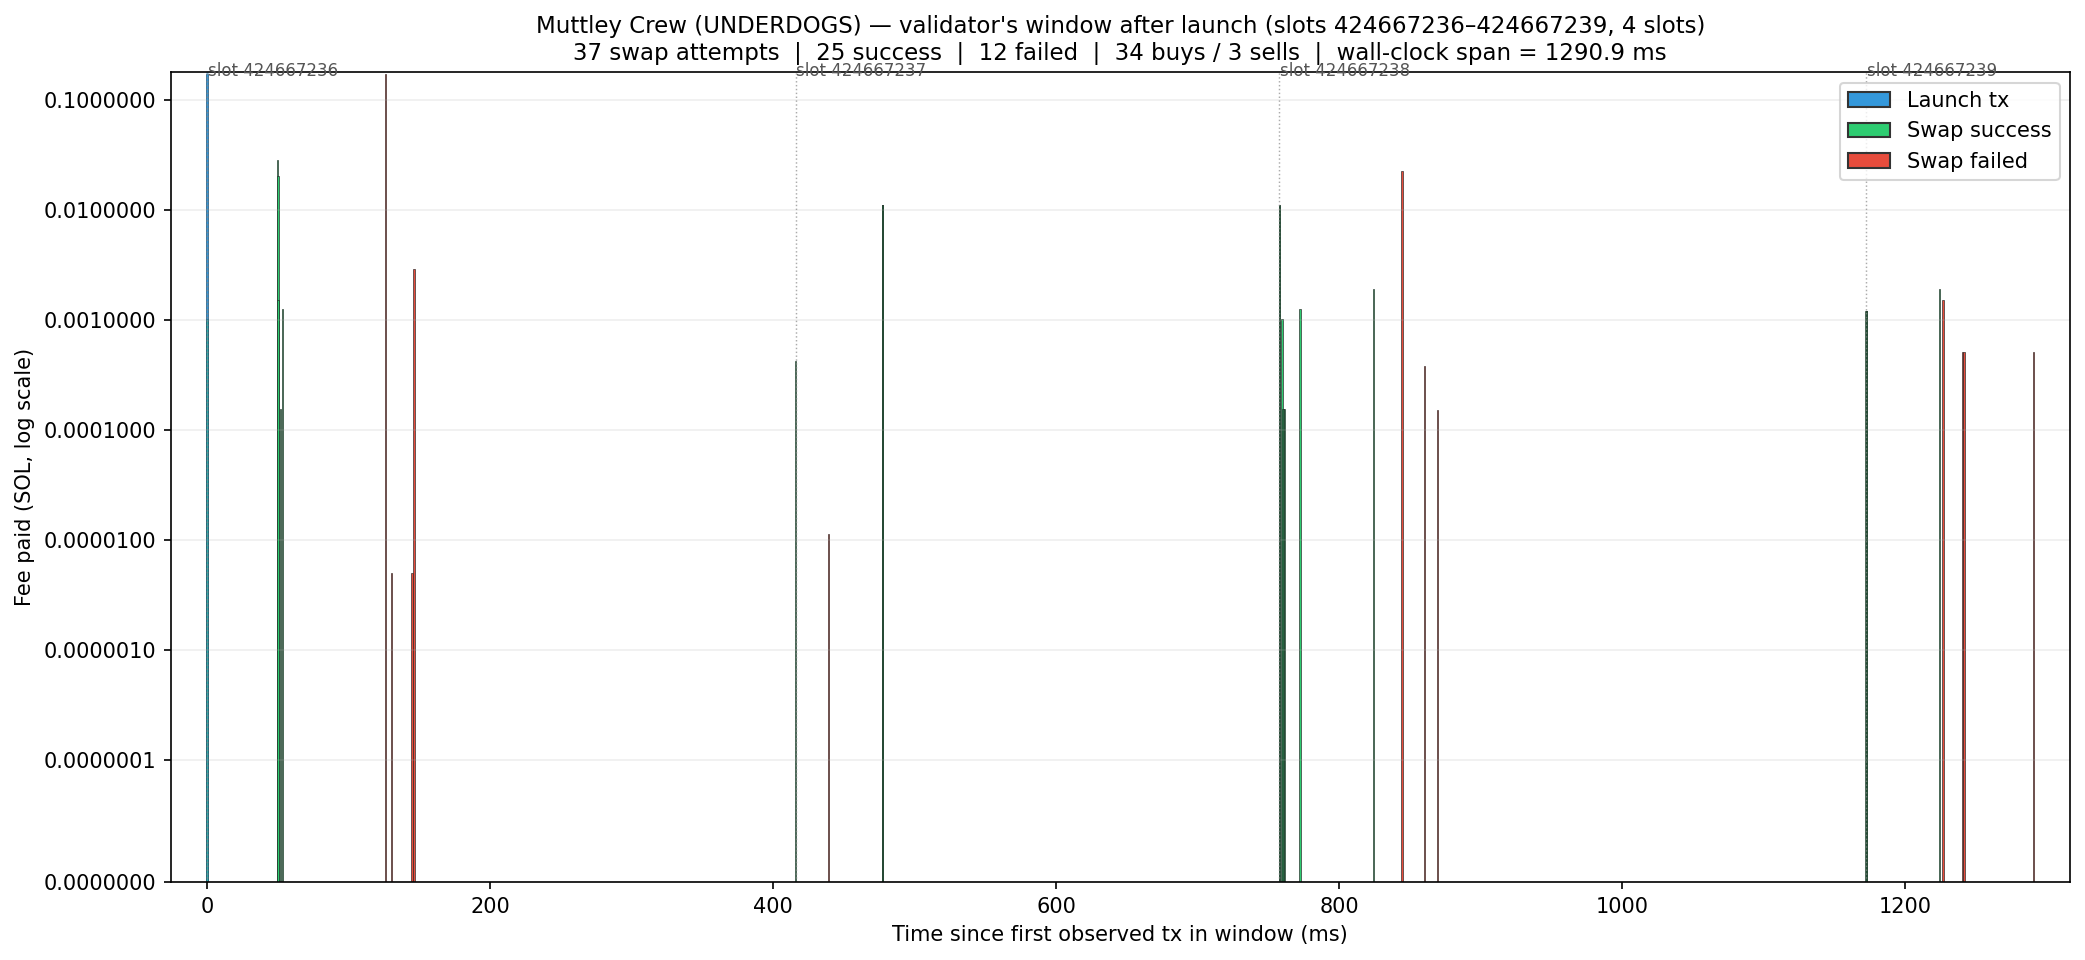
The blue bar at t=0 is the token-creation transaction itself. What jumps out:
- First red bar at 126 ms. Someone was watching the geyser feed and fired a buy inside the launch slot itself, paying 0.169 SOL — the highest single fee in the window — and lost.
- Bursts have microsecond-tight spacing. The geyser
entry_timestampresolves individual transactions to ~1 μs; many txs in the densest clusters are sub-millisecond apart. - Failed bidders paid more than successful ones (0.198 SOL vs 0.120 SOL). On this validator, height did not buy you a position.
Launch #2 — BountyBoy
- Validator’s window: slots 424,585,656 → 424,585,659 (4 slots)
- 39 swap attempts inside the window: 29 succeeded / 10 failed (26% fail rate); 36 buys / 3 sells
- Wall-clock span: 1,004.3 ms
- Total fees paid: 0.207 SOL, of which 0.136 SOL (66%) was burned by failed attempts
- Median gap between consecutive transactions: 2.8 ms
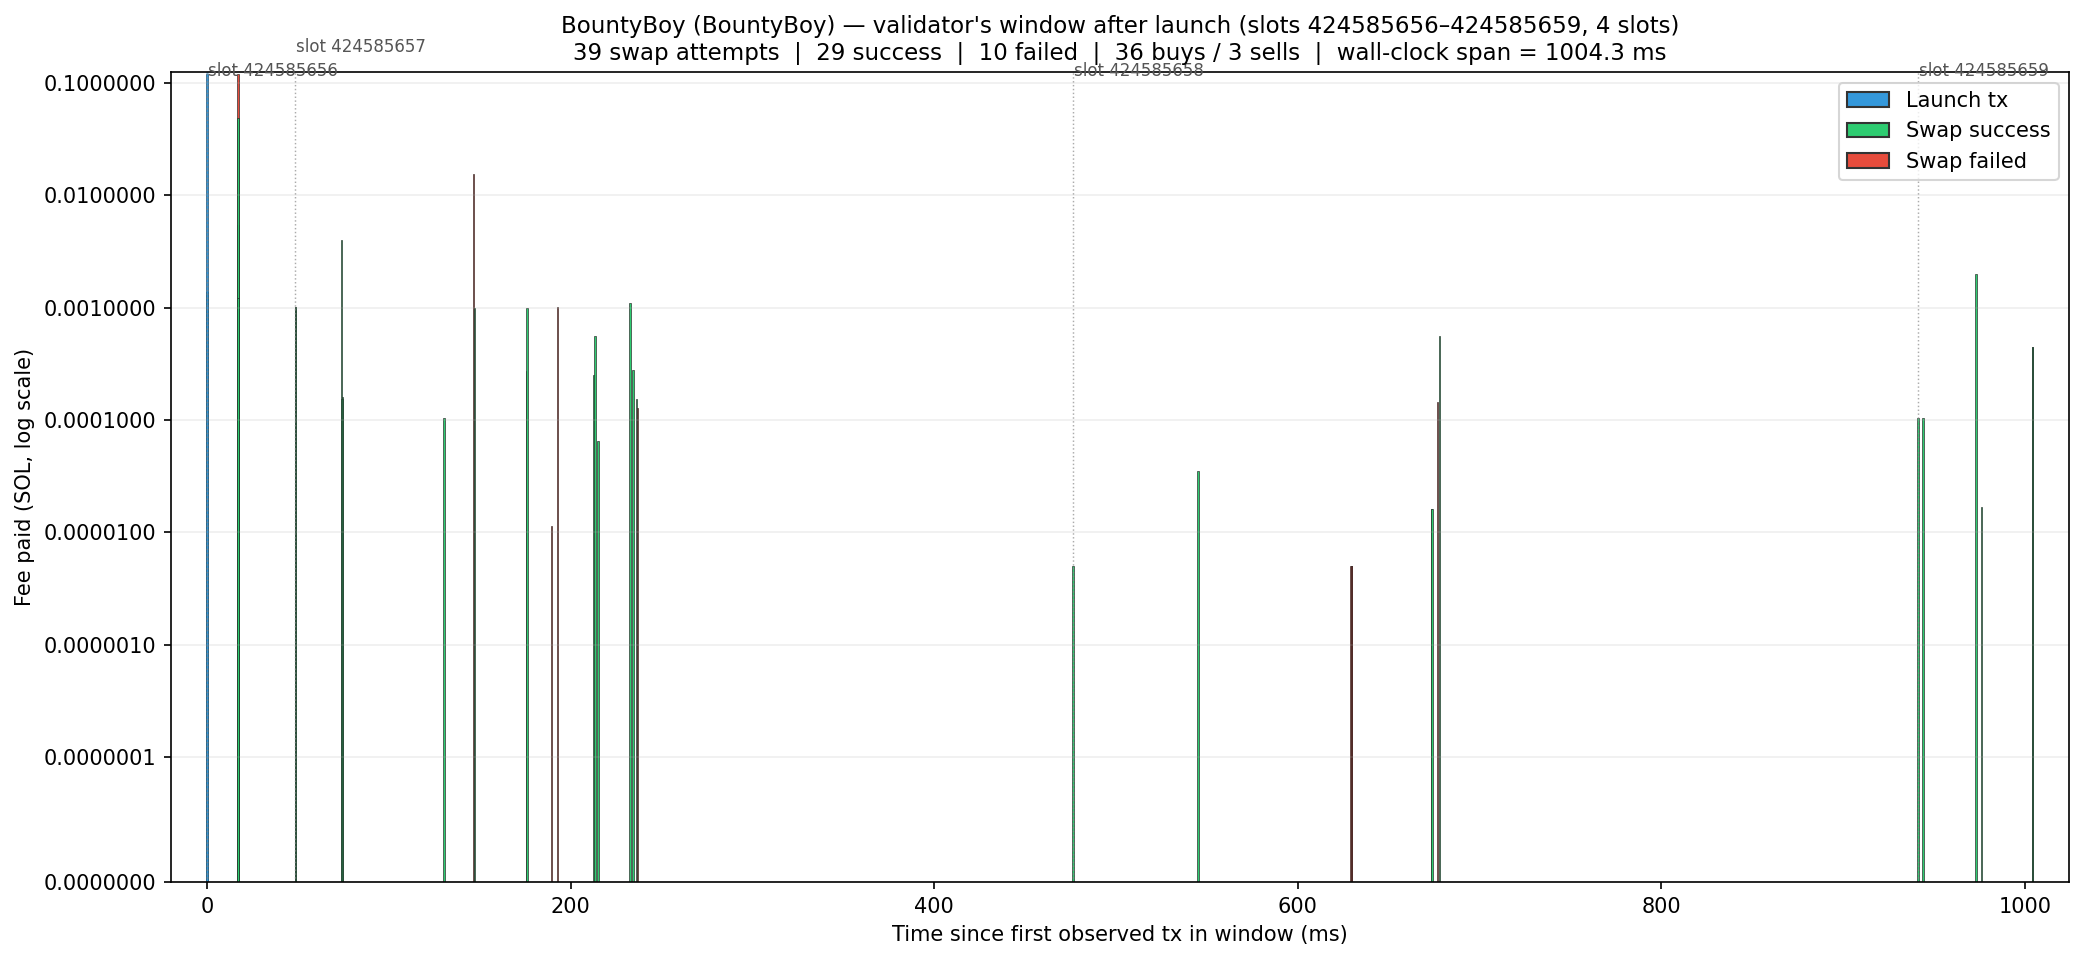
The shape is different:
- The fight starts immediately — first failed bid at 17 ms. Snipers must have had a much faster feed; one of them paid 0.119 SOL for nothing within milliseconds of the launch transaction.
- Contention is over by ~250 ms. Slot counts: 5 / 19 / 9 / 6. Almost half the activity lives in slot 424,585,657 — the slot immediately after the launch — and after that the validator’s window is mostly small green retail buys.
- Failed fees again dominate. 66% of the SOL paid into this window was paid by losing attempts.
What the comparison says about this validator
Both launches show the same structural pattern — a violent, expensive contention phase that’s almost entirely resolved inside the validator’s own leader window — but the timing of contention differs.
| UNDERDOGS | BountyBoy | |
|---|---|---|
| First failed sniper attempt | +126 ms | +17 ms |
| Swap attempts in window | 37 (34 buys / 3 sells) | 39 (36 buys / 3 sells) |
| Success / Fail | 25 / 12 (32%) | 29 / 10 (26%) |
| Total fees paid | 0.318 SOL | 0.207 SOL |
| Of which lost to failures | 0.198 SOL (62%) | 0.136 SOL (66%) |
| Span (4 slots, validator only) | 1,290.9 ms | 1,004.3 ms |
Two observations:
- The fight stays inside this validator’s window. Across both launches, more than 70% of the contention is over before the leader rotation ends — meaning a snipe bot that doesn’t already have a fast pipe to this leader has effectively lost before the next validator even gets a slot.
- The biggest fees are paid by losers. In both cases, the single largest fee in the window came from a failed transaction. Snipers are bidding the priority-fee market based on opportunity value, not on landing probability.
Why this representation matters
If you only have slot + tx_idx, you can rank the order of buys but you cannot tell whether two transactions are 0.7 ms apart or 200 ms apart. The geyser entry_timestamp resolves that. Scoping the window to a single validator’s slots tells you what that validator alone witnessed — which is the right frame for asking “did the validator give anyone an advantage?” and “did snipers burn fees on this validator vs another?”
The visual takeaway: most of a validator’s 1-second leader window during a hot launch is empty time. The fight is two or three 50–100 ms bursts. The rest is decoration. Lowering latency-to-leader matters far more than raising the priority fee — both winning bidders here paid less than the average loser.
Technical details
Data sources
solana_blocks— to identify slots produced by validatorEvnRm…XqDo4and group them into leader runs (consecutive slots same validator).pumpfun_token_creation— for the mint and launch slot. Only launches whose creation slot belongs to one of this validator’s runs are considered.pumpfun_v2_swaps— every buy/sell attempt against the new token’s bonding curve, with success/failure status and realizedfee. Restricted to slots[launch_slot, run_end].tx_timestamps— geyser per-txentry_timestamp(unix seconds with fractional part) used as the x-axis.
Two caveats we hit
solana_blockssometimes contains duplicate rows for the same(slot, validator)— we deduplicate withSELECT DISTINCT slotbefore grouping into leader runs.pumpfun_v2_swapscan have multiple rows per(slot, tx_idx, signature)(one per swap instruction within the same transaction). We collapse them withGROUP BY slot, tx_idx … any(*)so each transaction contributes exactly one bar.
Interactive viewer
A live version where you can paste any validator address and render the top 3 launches in this format is bundled with this research as the pumpfun-launch-timeline app — paste a validator pubkey and you get the same chart for any leader.
Reproducibility
uv run experiments/validator_launch_timeline/01_find_launches.py
uv run experiments/validator_launch_timeline/02_fetch_tx_data.py
uv run experiments/validator_launch_timeline/03_plot_timelines.py
This research was conducted by Onchain Divers. The complete analysis code is available in our research repository.